TA achievements
1. TAs fuel the growth of OA

TAs are a driving force behind the growth of OA. In 2023 alone, there were over 44,000 OA articles published under 44 Springer Nature TAs, a 46% increase from 2015-202316. TAs contributed seven times more gold OA articles as a share of OA publications across all Springer hybrid journals, compared to authors choosing OA outside of an agreement.
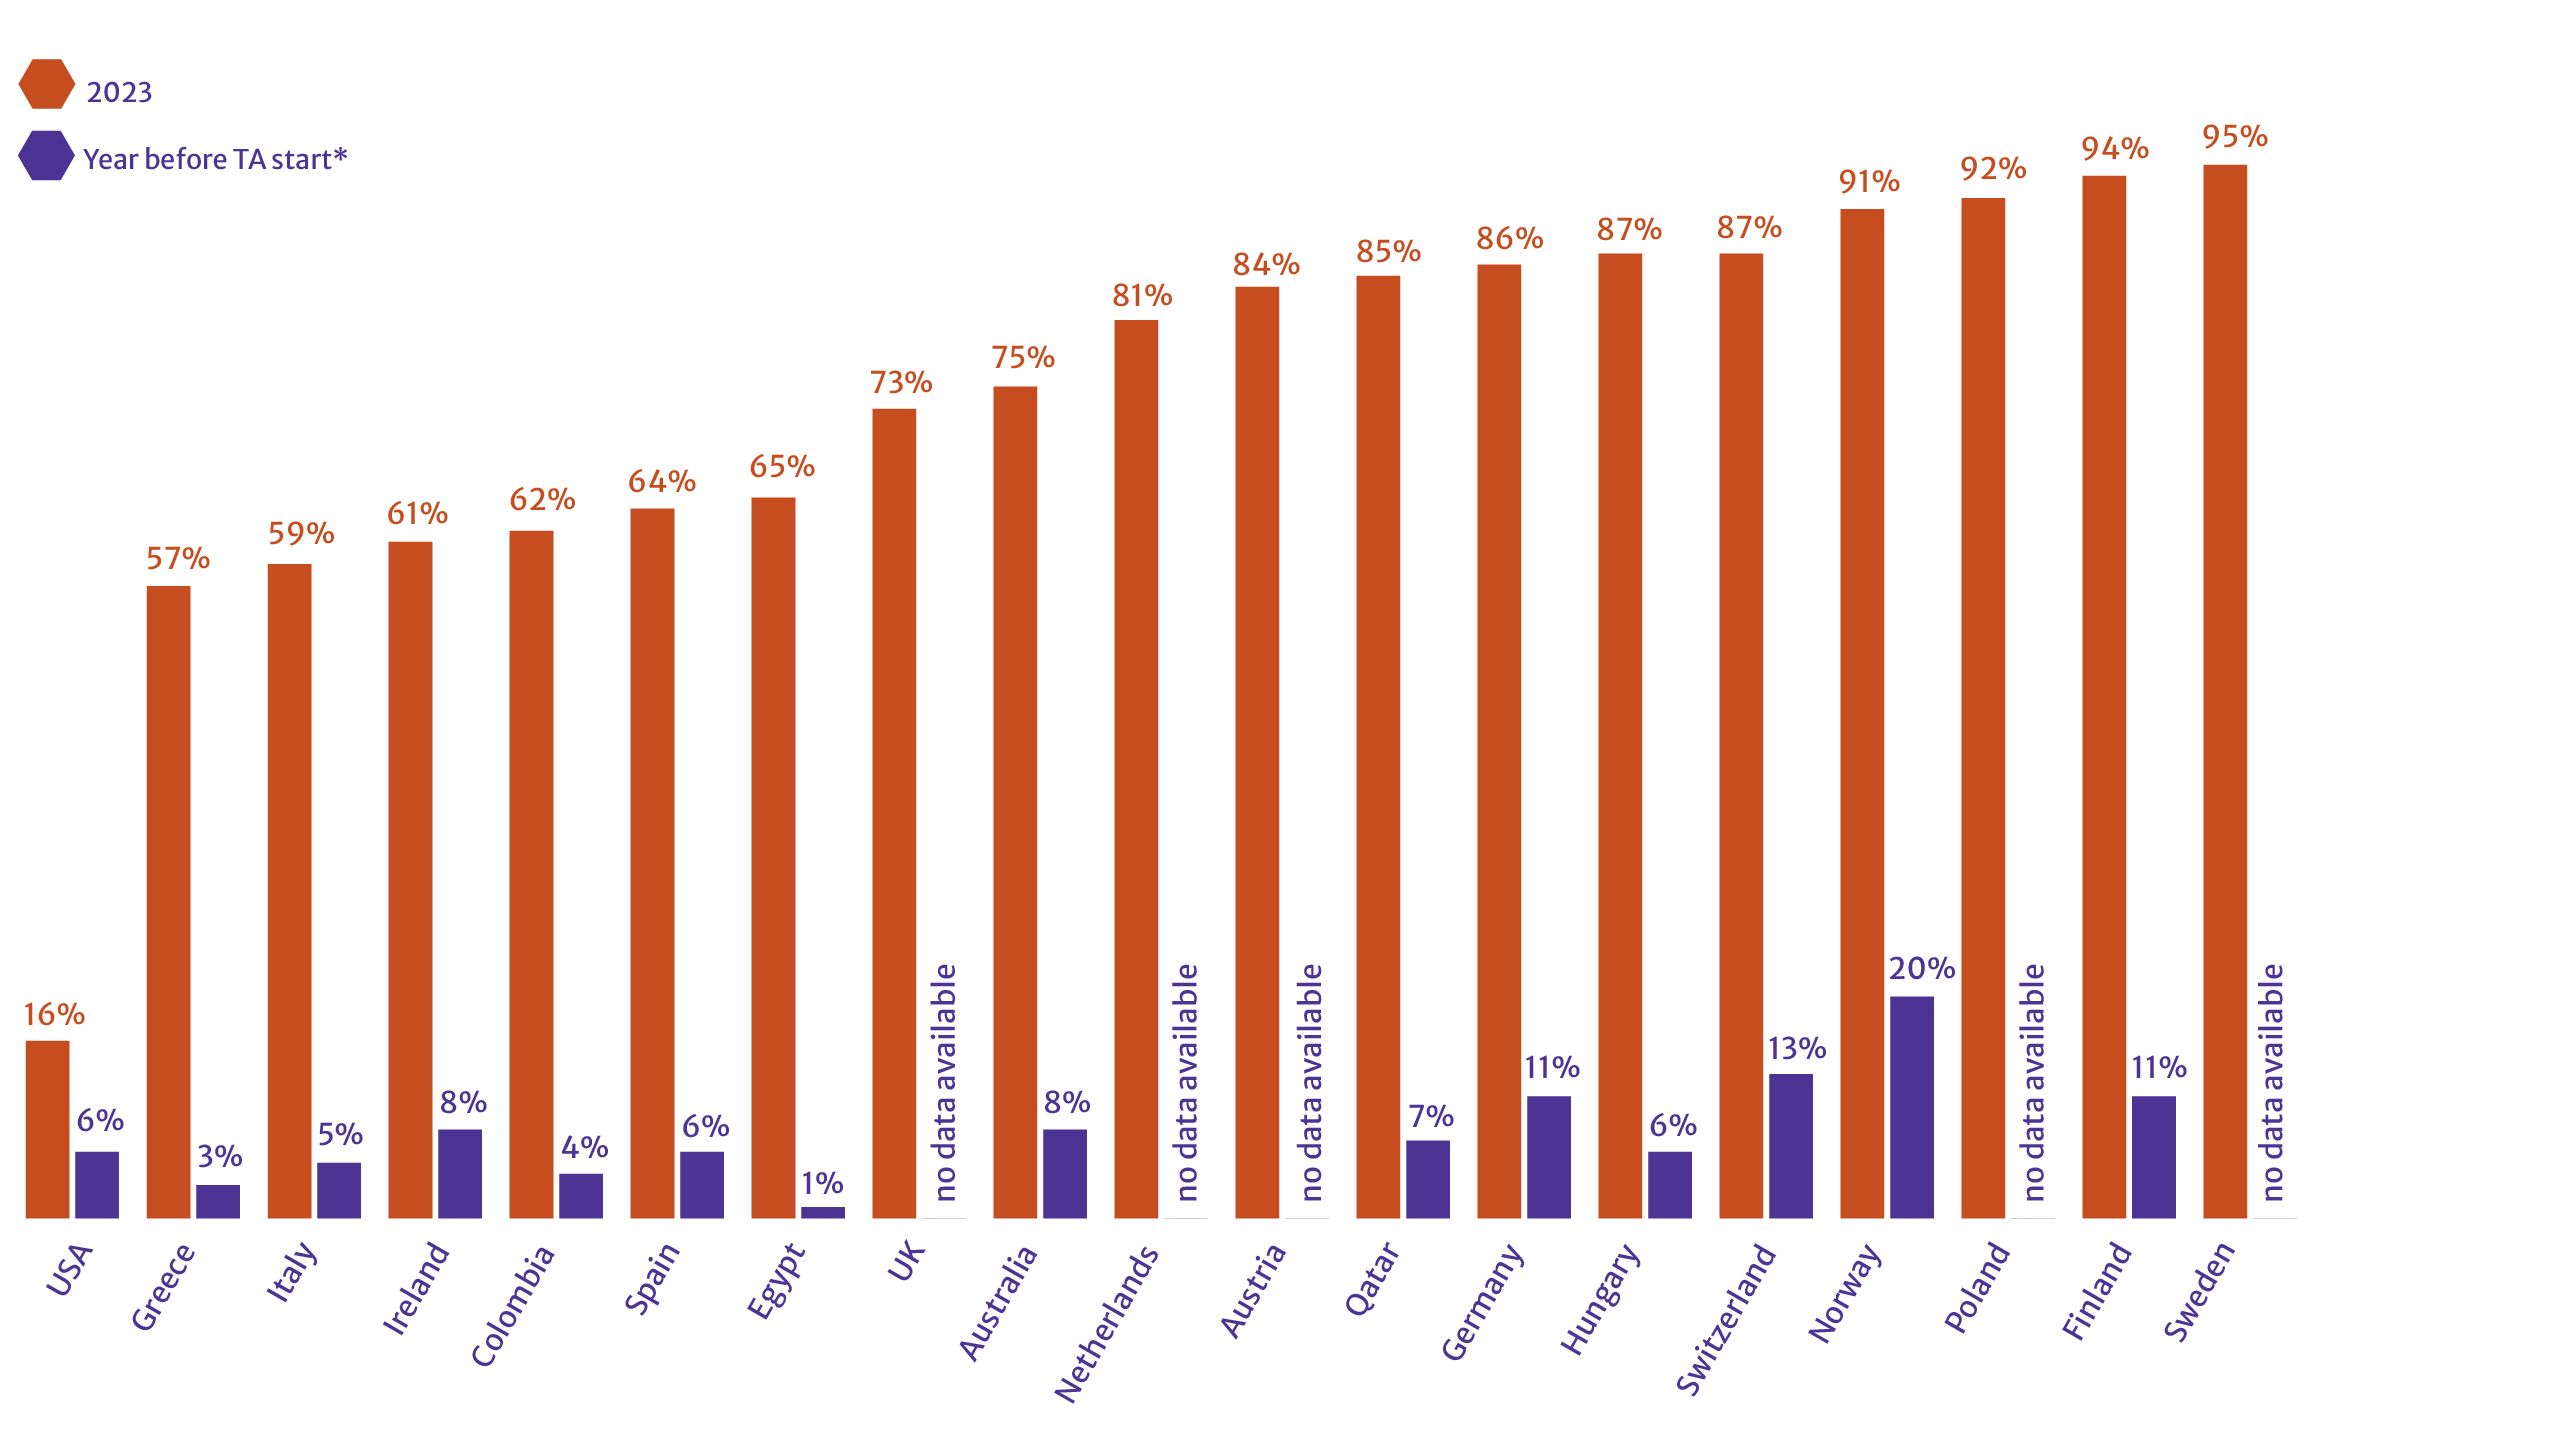
Our data shows that the availability of a TA dramatically increases the uptake of OA by eligible researchers within a country. In most cases, these countries had OA publication rates of less than 10% before the start of their agreements (Fig. 1). By 2023, several countries with a TA had achieved OA shares of over 90%, including Sweden, Finland, and Poland.
Figure 1: Uptake of OA as a proportion of eligible hybrid publications, before agreement and in 2023
* Years before TA start range from 2017-2022
Table 1: Uptake of OA as a proportion of eligible hybrid publications, before agreement and in 2023
|
USA |
Greece |
Italy |
Ireland |
Colombia |
Spain |
Egypt |
UK |
Australia |
Netherlands |
Austria |
Qatar |
Germany |
Hungary |
Switzerland |
Norway |
Poland |
Finland |
Sweden |
|
|---|---|---|---|---|---|---|---|---|---|---|---|---|---|---|---|---|---|---|---|
|
2023 |
16% |
57% |
59% |
61% |
62% |
64% |
65% |
73% |
75% |
81% |
84% |
85% |
86% |
87% |
87% |
91% |
92% |
94% |
95% |
|
Year |
6% |
3% |
5% |
8% |
4% |
6% |
1% |
** |
8% |
** |
** |
7% |
11% |
6% |
13% |
20% |
** |
11% |
** |
* Years before TA start range from 2017-2022
** No data available
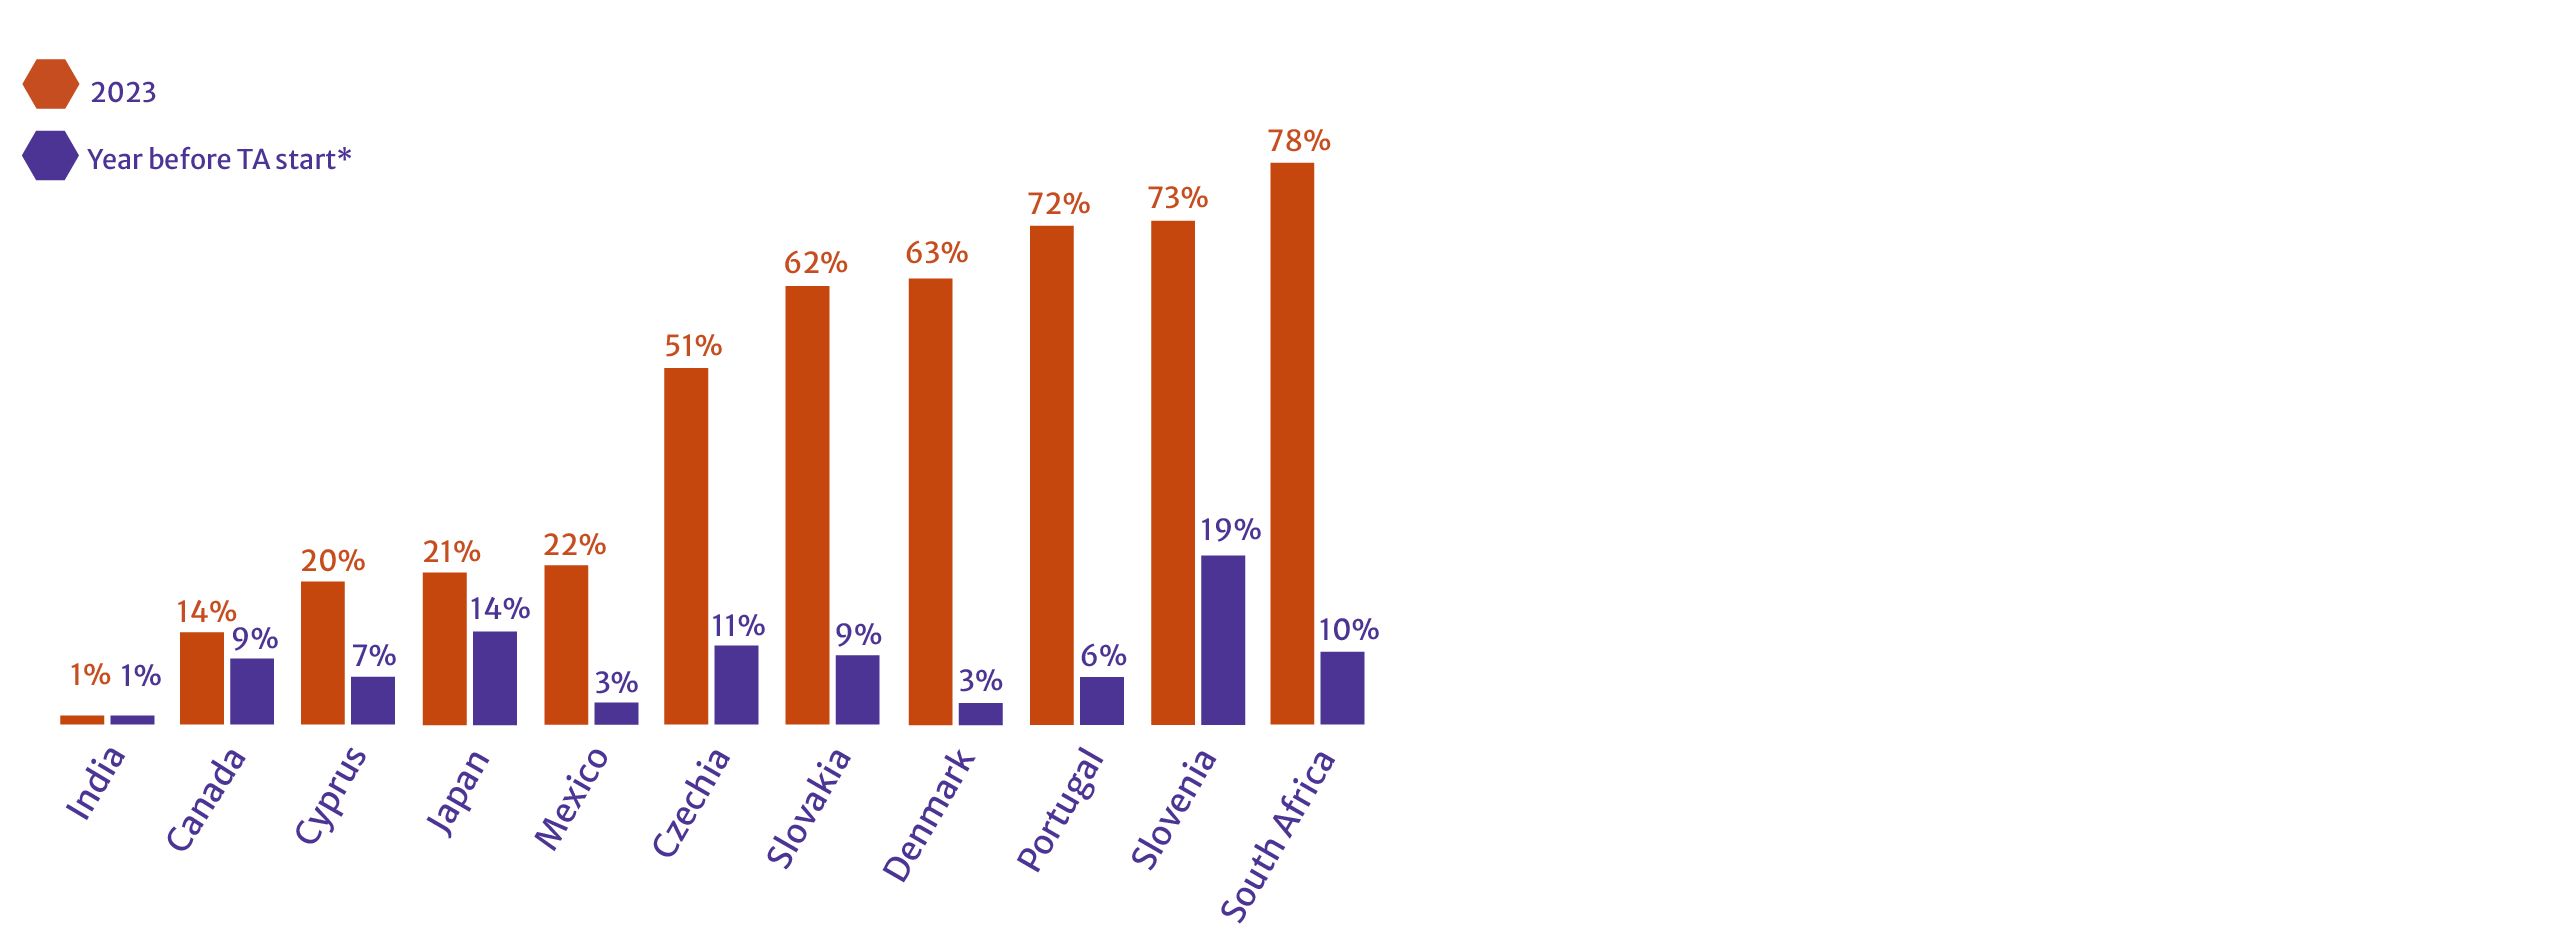
The impact from TAs on OA uptake is not only sustained, as seen in countries with longer-standing agreements, but is also immediate. For agreements that launched in 2023, including Slovenia and South Africa, OA publication growth in the first year is in some cases as high as 1100% (Fig. 2). For Lyrasis, which is still in its first year, the immediate growth in OA uptake is evident: in the first six months of their TA they have already published 533 articles OA, compared to 140 articles in the entire previous year.
Figure 2: 2021-2023 agreement launches – uptake of OA as a proportion of eligible hybrid publications
* Years before TA start range from 2017-2022
Some agreements shown here are not on a national scale
Table 2: 2021-2023 agreement launches – uptake of OA as a proportion of eligible hybrid publications
|
India |
Canada |
Cyprus |
Japan |
Mexico |
Czechia |
Slovakia |
Denmark |
Portugal |
Slovenia |
South Africa |
|
|---|---|---|---|---|---|---|---|---|---|---|---|
|
2023 |
1% |
14% |
20% |
21% |
22% |
51% |
62% |
63% |
72% |
73% |
78% |
|
Year |
1% |
9% |
7% |
14% |
3% |
11% |
9% |
3% |
6% |
19% |
10% |
*Years before TA start range from 2017-2022
Some agreements shown here are not on a national scale
“This is our second year where we are going to evaluate the buy-in from academics. So far, the data for the first two quarters indicates that there is steady growth in the uptake of OA publishing in the university.”
Lazarus Matizirofa, Deputy Director, Department of Library Services at the University of Pretoria, South Africa
To learn more about how TAs are enabling a global shift towards OA, click on each achievement below.

