Current practices
in sharing null results


Following on from the positive perceptions and experiences around the use and sharing of null results highlighted in Section 1, this section will explore the current practices of sharing these findings, by addressing the following questions:
- How common are null results?
- Are null results being shared?
- How are null results being shared?
2.1 How common are null results?
Over half (53%) of researchers have obtained null results in a project that generated solely or mostly null results. 41% of all researchers generated null results from at least one research project in the last three years, including 1% with more than ten projects obtaining null results in the last three years (n=11,069).
39% had not conducted or participated in a research project that generated solely or mostly null results, and 8% were unsure.
Looking at responses by discipline, researchers in Biology and Medicine are the most likely to have generated null results, at 60% and 59% respectively. The prevalence for obtaining null results is lowest within the Arts & Humanities (35%), followed by Business and Investment and Earth & Environmental Science (both at 43%), and Engineering (44%).
Figure 4: Prevalence of null results across different fields


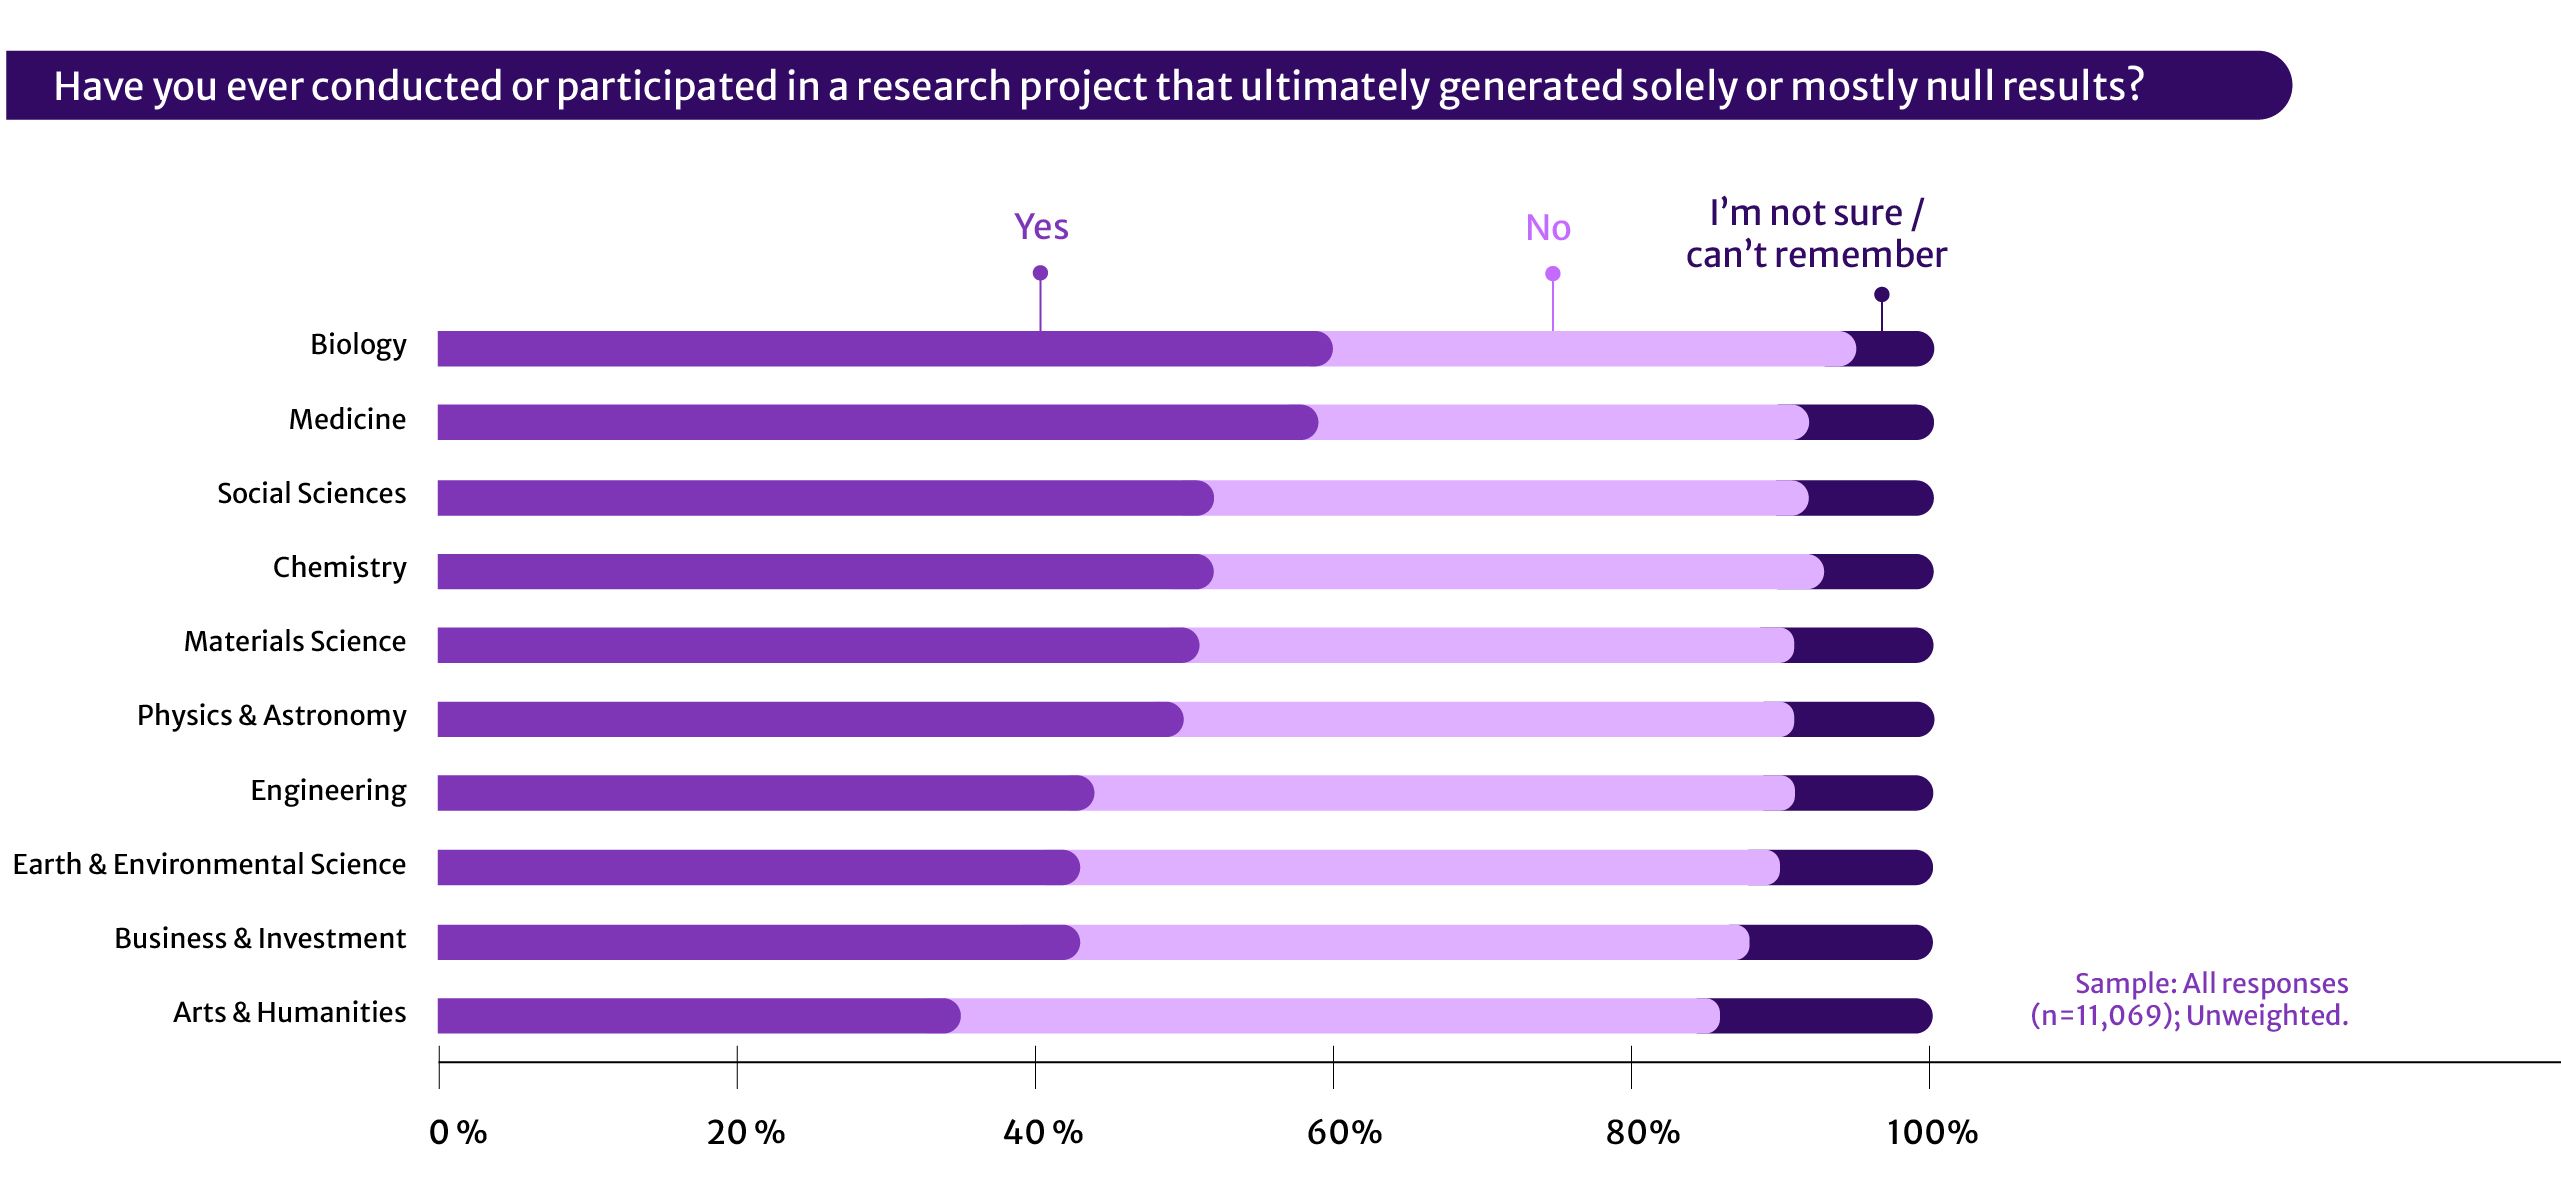
Table 4: Prevalence of null results across different fields
|
Have you ever conducted or participated in a research project that ultimately generated solely or mostly null results? |
||||||||||
|---|---|---|---|---|---|---|---|---|---|---|
|
Biology |
Medicine |
Chemistry |
Social Sciences |
Materials Science |
Physics & Astronomy |
Engineering |
Earth & Environ. Science |
Business & Investment |
Arts & Humanities |
|
|
Yes |
60% |
59% |
52% |
52% |
51% |
50% |
44% |
43% |
43% |
35% |
|
No |
35% |
33% |
40% |
41% |
40% |
41% |
47% |
47% |
45% |
51% |
|
I’m not sure / can’t remember |
6% |
8% |
8% |
7% |
9% |
9% |
9% |
10% |
13% |
14% |
|
Column n |
2269 |
2928 |
497 |
1469 |
425 |
686 |
1368 |
921 |
181 |
325 |
Sample: All responses (n=11,069); Unweighted.
Interestingly, there was more of a discrepancy when examining responses by region. USA and Canada gave the highest positive response of generating null results (65%), with the lowest being Africa at 39% and India at 43%. Further research could be undertaken to examine these regional differences.
Figure 5: Prevalence of null results across different regions


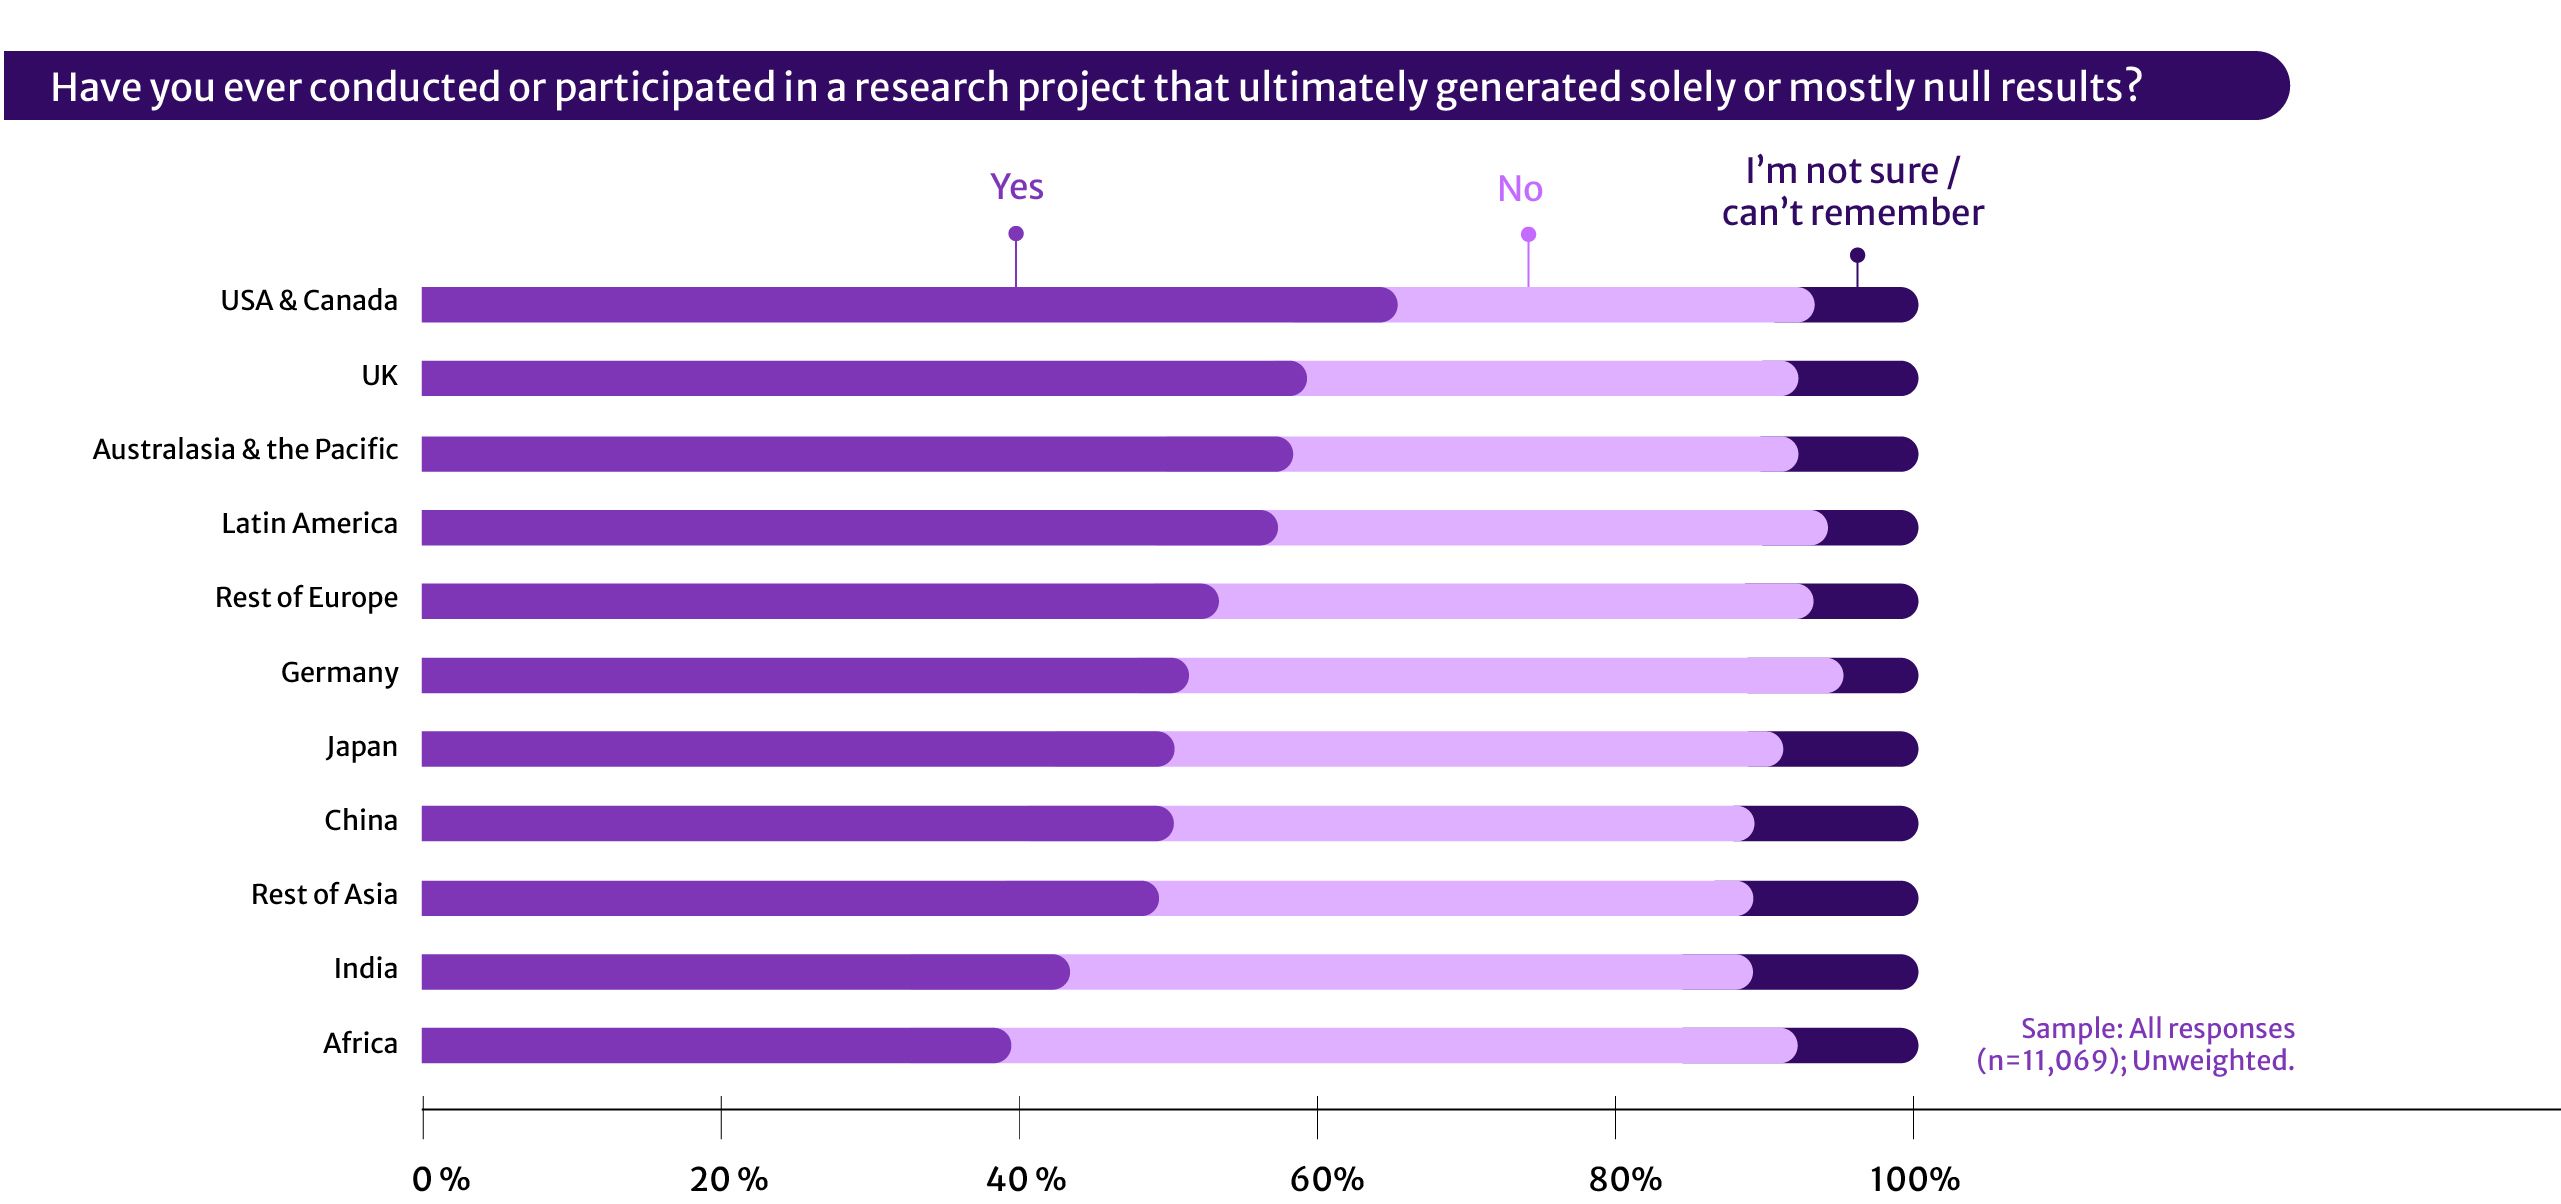
Table 5: Prevalence of null results across different regions
|
Have you ever conducted or participated in a research project that ultimately generated solely or mostly null results? |
|||||||||||
|---|---|---|---|---|---|---|---|---|---|---|---|
|
USA & Canada |
UK |
Australasia & the Pacific |
Latin America |
Rest of Europe |
Germany |
Japan |
China |
Rest of Asia |
India |
Africa |
|
|
Yes |
60% |
59% |
52% |
52% |
51% |
50% |
44% |
43% |
43% |
35% |
39% |
|
No |
35% |
33% |
40% |
41% |
40% |
41% |
47% |
47% |
45% |
51% |
53% |
|
I’m not sure / can’t remember |
6% |
8% |
8% |
7% |
9% |
9% |
9% |
10% |
13% |
14% |
7% |
|
Column n |
2269 |
2928 |
497 |
1469 |
425 |
686 |
1368 |
921 |
181 |
325 |
882 |
2.2 Are null results being shared?
Despite over half of researchers obtaining null results, they are not always being shared, with only 68% of those who have collected null results sharing them (n=7,057). 25% stated that they had never shared, or tried to share, null results generated in their research, and 6% could not remember whether they had shared them.
Even among researchers who consider sharing null results very important, and who collected mostly/solely null results themselves (n=3,989), only 74% have shared them, indicating a gap between intention and action.
Null results sharing behaviour varies by subject area, with researchers from the Social Sciences (75%), Medicine (73%) and Arts and Humanities (72%) having shared their null results previously. Engineering and Materials Science are least likely to share, with 36% having never shared or tried to share null results generated in their research.
Regionally, researchers from Australasia and the Pacific are the most likely to share (79%), followed by the UK (75%) and North America (74%). Researchers in China are the least likely to share, with 35% of respondents never having shared, or tried to share, null results generated in their research.
There is a smaller variation by researcher seniority (based on job title), where 75% of senior career researchers, 69% of mid-career researchers, and 59% of early career researchers have shared or tried to share null results. This could be explained by senior researchers having generated more cases of null results, giving them more opportunities to have shared them, compared to less senior researchers.
2.3 How are null results being shared?
The three most popular methods of sharing null results are:
- Directly with individual researchers in their field e.g. email, personal conversation (32%)
- At a conference eg poster or presentation (32%)
- Submitting a manuscript based (solely or mostly) on null results to a journal (30%).
Other methods included posting a preprint to a server (6%), uploading the raw dataset to a data repository (6%), or another channel (5%) - such as including them as part of a larger study or book “so that all of the results were not null”.
Figure 6: The different channels researchers have used to share null results


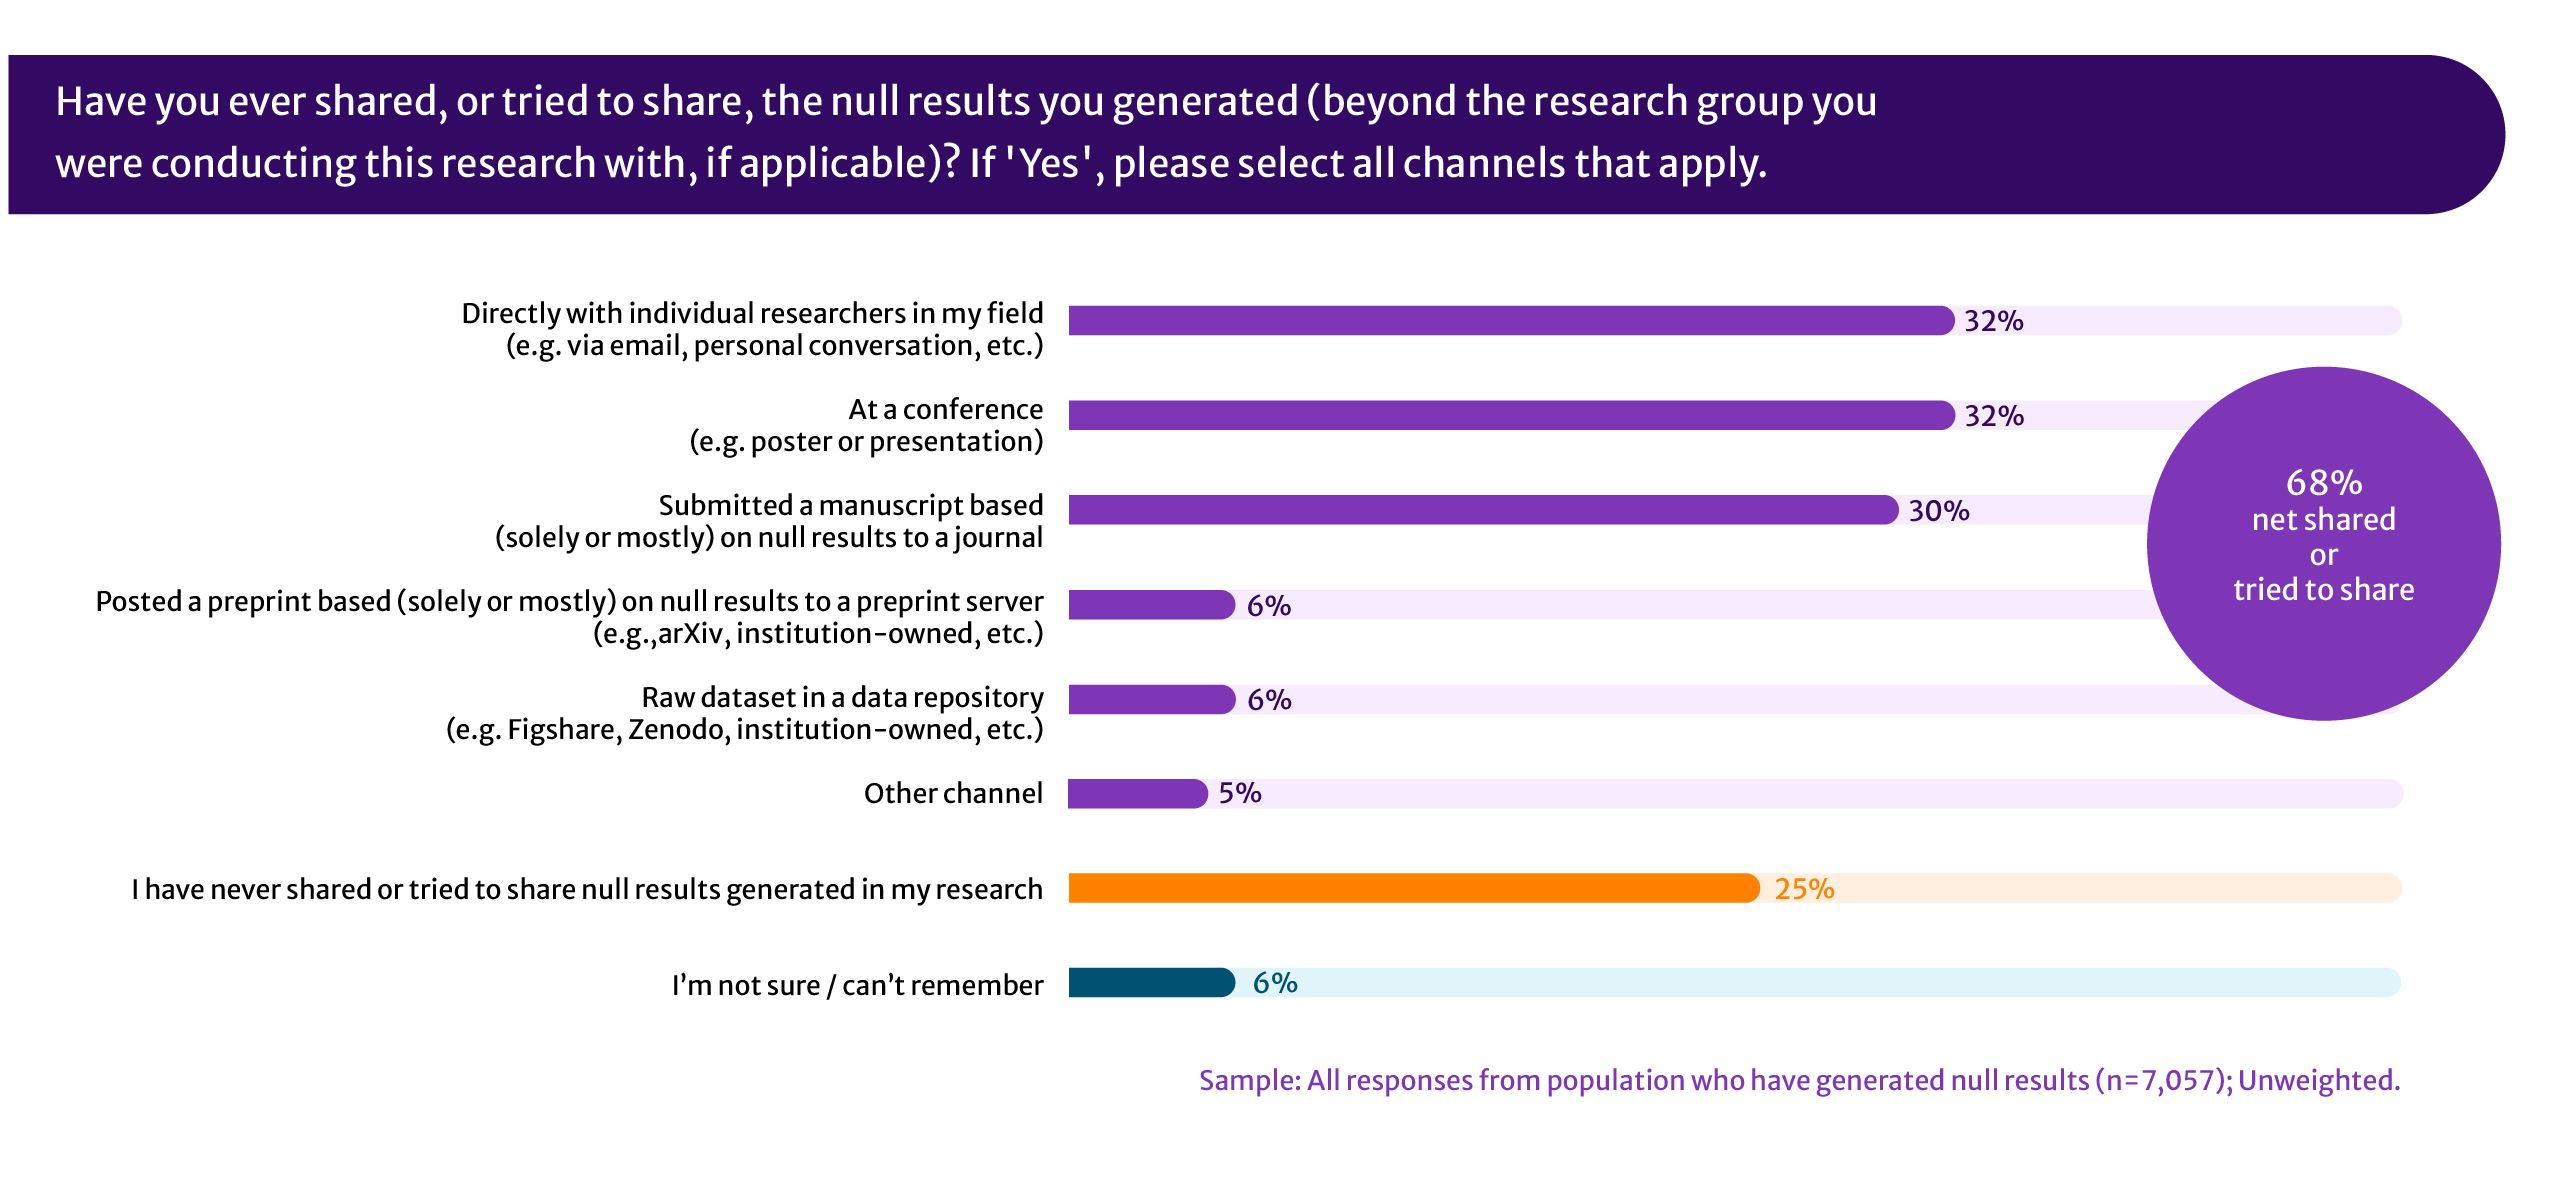
Table 6: The different channels researchers have used to share null results
|
Have you ever shared, or tried to share, the null results you generated (beyond the research group you were conducting this research with, if applicable)? |
|||
|---|---|---|---|
|
Directly with individual researchers in my field (e.g. via email, personal |
32% |
68% |
net shared or tried to share |
|
At a conference (e.g. poster or presentation) |
32% |
||
|
Submitted a manuscript based (solely or mostly) on null results to a journal |
30% |
||
|
Posted a preprint based (solely or mostly) on null results to a preprint server (e.g. arXiv, institution-owned, etc.) |
6% |
||
|
Raw dataset in a data repository (e.g. Figshare, Zenodo, institution-owned, etc.) |
6% |
||
|
Other channel |
5% |
||
|
I have never shared or tried to share null results generated in my research |
25% |
||
|
I’m not sure / can’t remember |
6% |
||
Sample: All responses from population who have generated null results (n=7,057); Unweighted.
However, the gap between intention and action continues when we examine how researchers are sharing null results compared to their view of the usefulness of each channel. The most useful method of sharing null results was via publication in a peer-reviewed journal: 87% of respondents think that is a ‘very useful’ or ‘moderately useful’ method of sharing. However, only a minority of those respondents (33%) had shared their own null results via this method.
Direct sharing with individuals was considered the least useful method, although with an agreement rate of 69% about its usefulness, this is still high. From those who had rated direct sharing as ‘very useful’ or ‘moderately useful’, only 37% had in practice shared null results via this route.
Figure 7: Researchers’ perception of how useful various channels are when sharing null results


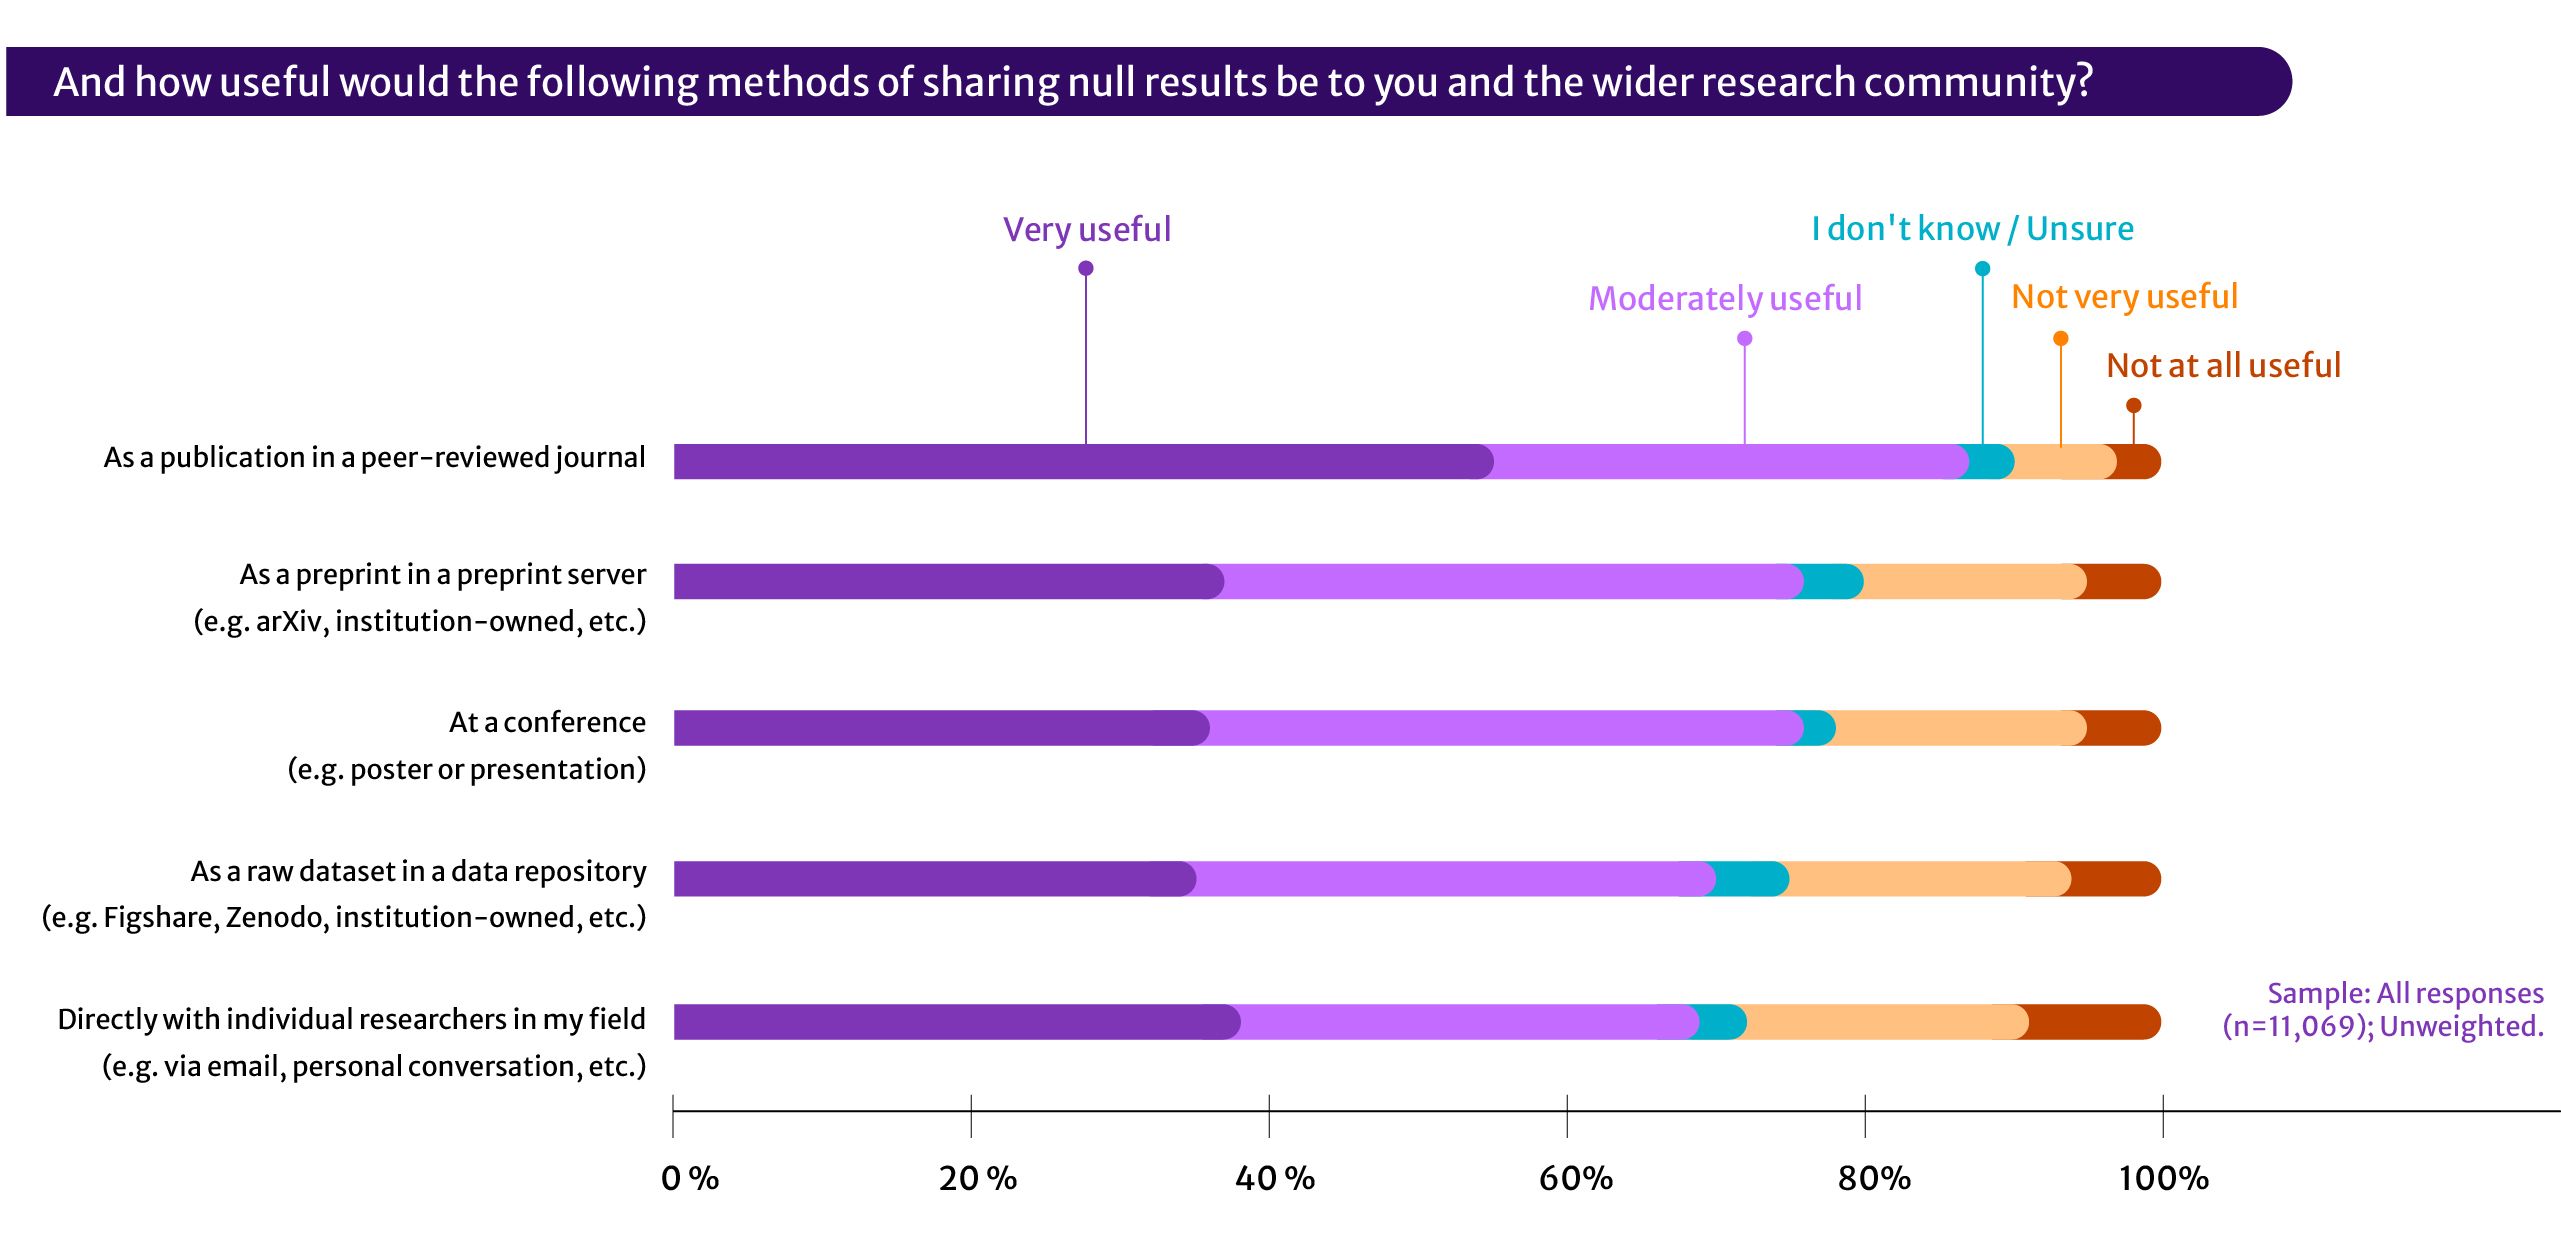
Table 7: Researchers’ perception of how useful various channels are when sharing null results
|
How useful would the following methods of sharing null results be to you and the wider research community? |
|||||||
|---|---|---|---|---|---|---|---|
|
Very useful + Moderately useful |
Very useful |
Moderately useful |
I don't know / Unsure |
Not very useful |
Not at all useful |
Not very useful + Not at all useful |
|
|
As a publication in a peer-reviewed journal |
87% |
55% |
32% |
3% |
7% |
3% |
10% |
|
As a preprint in a preprint server (e.g. arXiv, institution-owned, etc.) |
76% |
37% |
39% |
4% |
15% |
5% |
20% |
|
At a conference (e.g. poster or presentation) |
76% |
36% |
40% |
2% |
17% |
5% |
22% |
|
As a raw dataset in a data repository (e.g. Figshare, Zenodo, institution-owned, etc.) |
70% |
35% |
35% |
5% |
19% |
6% |
26% |
|
Directly with individual researchers in my field (e.g. via email, personal conversation, etc.) |
69% |
38% |
31% |
3% |
19% |
8% |
28% |
Sample: All responses (n=11,069); Unweighted.