
Findings across all disciplines:
Gold OA articles have more reach and impact
The findings of this white paper show that gold OA articles published in hybrid journals continue to achieve greater reach and impact compared to non-OA articles and green OA articles in those same journals. This reinforces the findings of our previous Going for Gold study in 2021, despite the growth and maturation of the OA landscape.18
18 Emery et al. (2021). See #2
Gold OA articles gain almost 7 times more downloads as non-OA articles
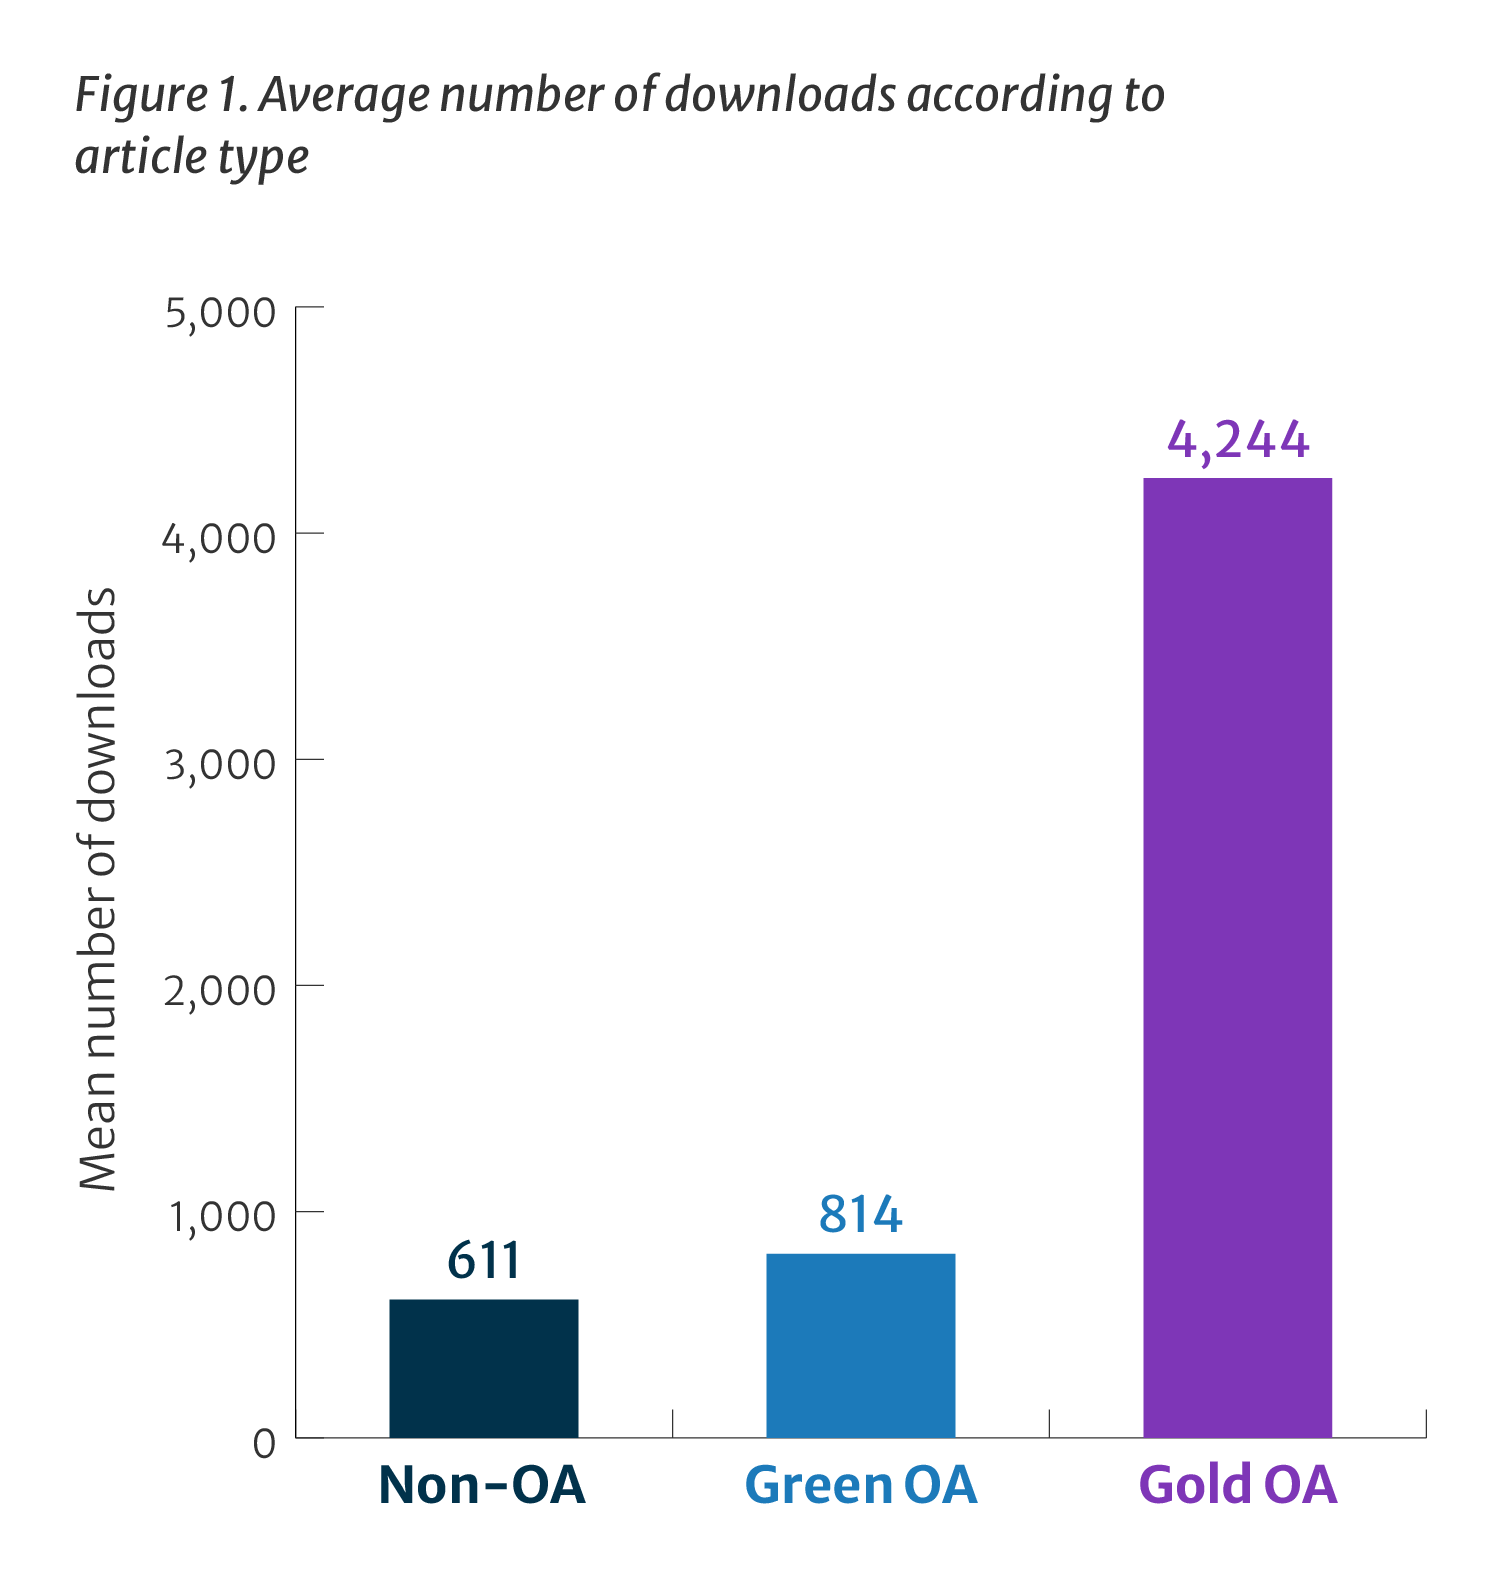
The download advantage for gold OA articles is overwhelming. Gold OA articles achieved 4,244 downloads on average by December 2025, compared to only 611 downloads for non-OA articles. This equates to gold OA articles having 6.94 times higher downloads (or 694%) as non-OA articles, with the predicted number of downloads (normalising for other factors that might influence this metric – see Methodology) at 7.46 times higher (or 746%).
Green OA articles have slightly more downloads than non-OA articles on average, 1.33 times higher (or 133%). However, downloads from institutional and subject repositories are not included in the figure.
The OA download advantage in this study follows the same trend as the findings from Going for Gold, 5 years prior to this study, with the average downloads for gold OA articles being substantially higher than the average downloads for both green OA and non-OA articles.19 In fact, the size of the download advantage is now even higher, suggesting a sustained and increased gold OA advantage.
Table 1. Average number of downloads by article type
|
Access type |
Non-OA |
Green OA |
Gold OA |
|---|---|---|---|
|
Number of articles |
145,189 |
11,494 |
48,098 |
|
Mean downloads |
611.32 |
813.59 |
4,243.68 |
|
Mean (%) |
100.00 |
133.09 |
694.18 |
|
Median |
446 |
527 |
2,907 |
|
Prediction |
614.54 |
828.21 |
4,584.98 |
|
Prediction (%) |
100.00 |
134.77 |
746.09 |
19 Emery et al. (2021). See #2

Gold OA has proven impact on accelerated dissemination
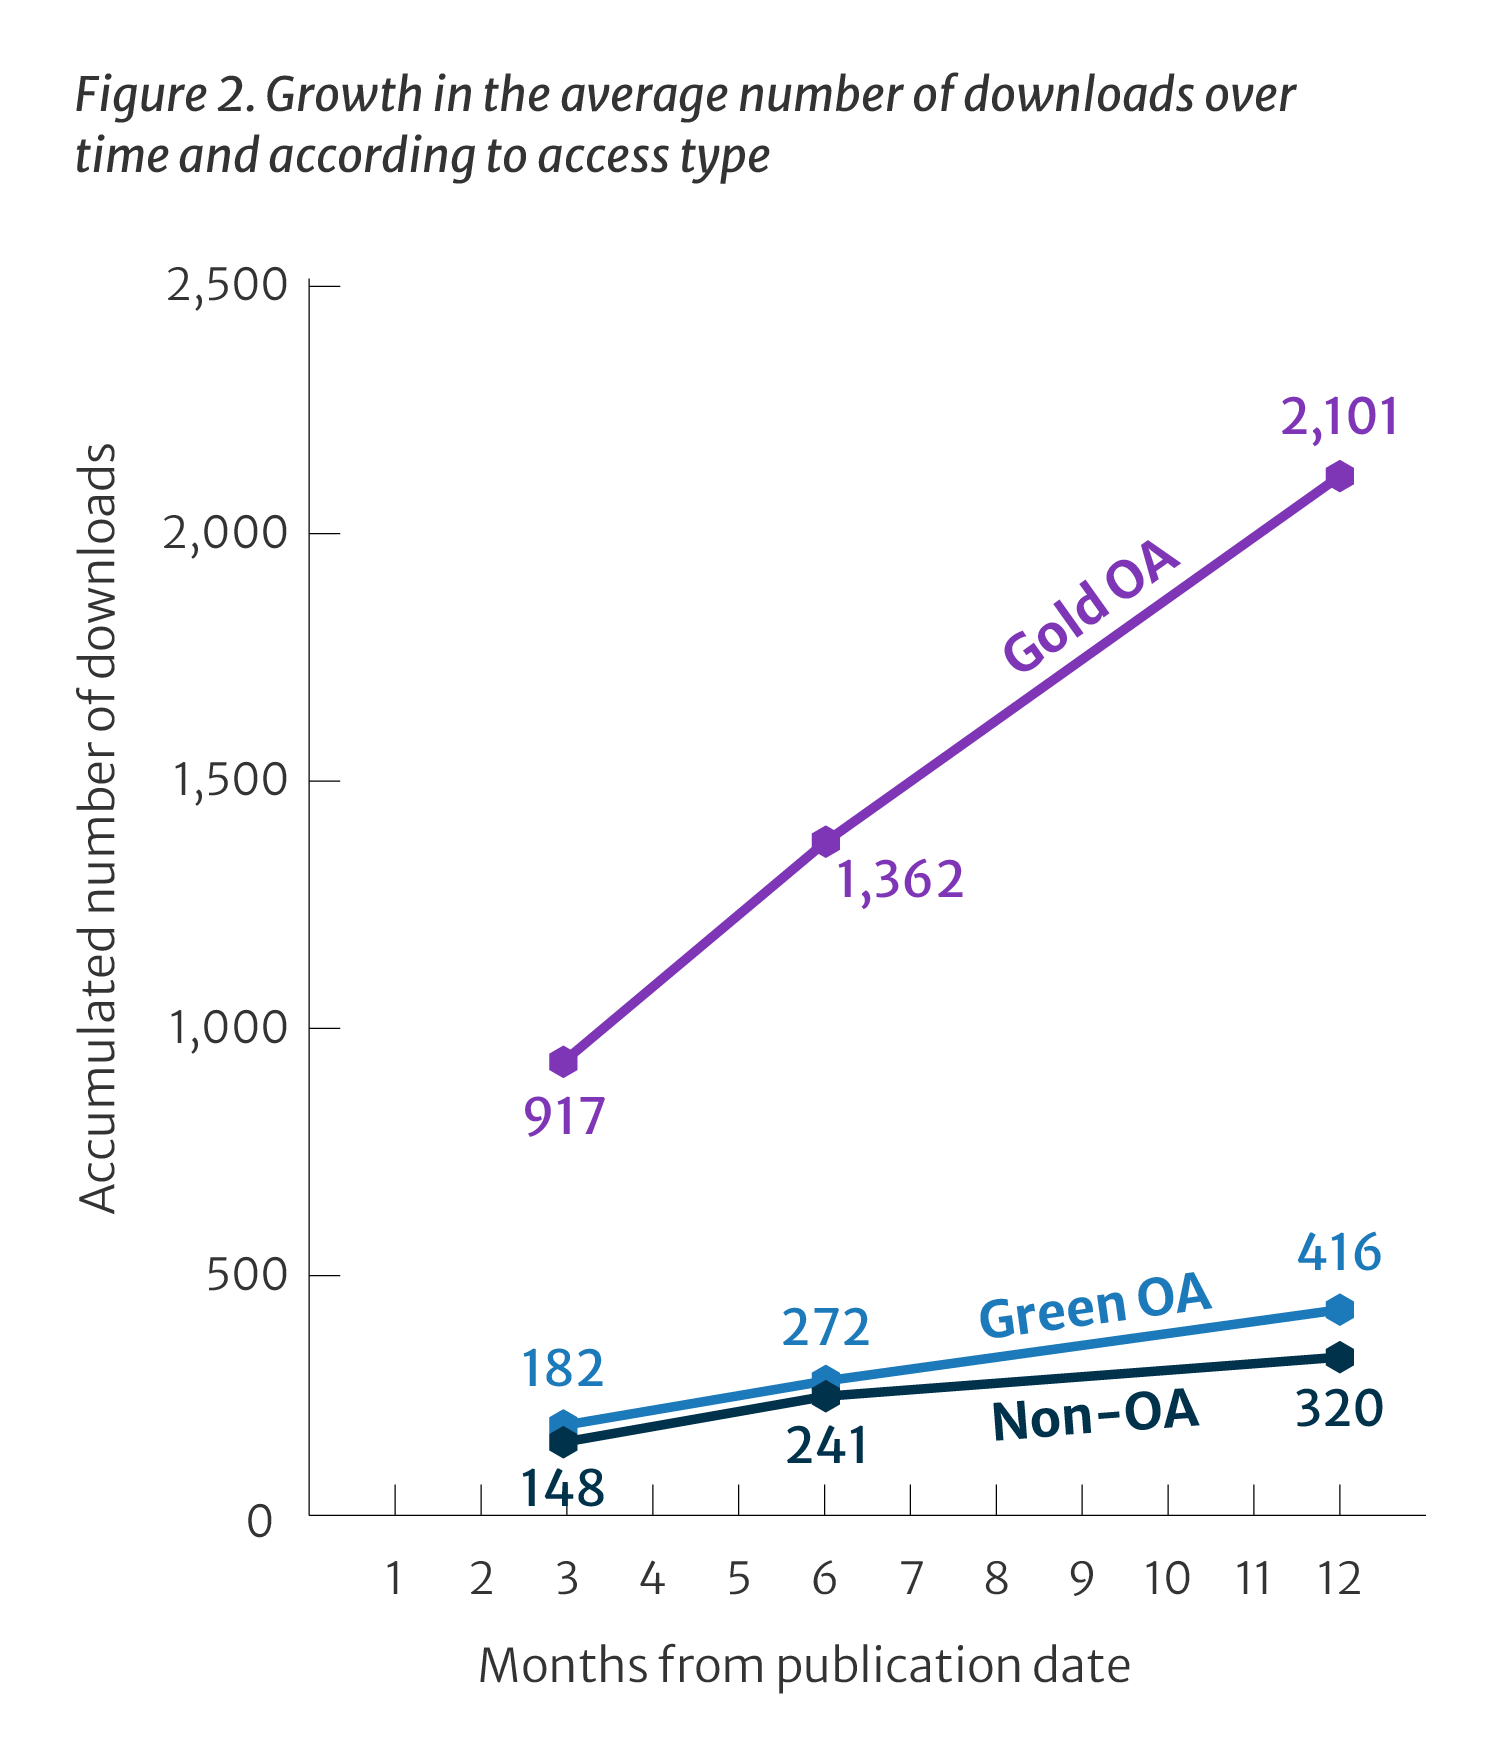
The gold OA advantage can also be seen to be immediate. After just 3 months, gold OA articles have had 917 downloads on average, compared to just 148 downloads for non-OA articles. This is 6.18 times higher downloads (or 618%) for gold OA articles than non-OA articles. The pattern is both repeated at 6 and 12 months, with the model predicting an even greater download advantage of 653% for gold OA articles.
Most importantly, on average a gold OA article after 3 months has been downloaded more often than a non-OA article after 12 months. On average, a non-OA article has only been downloaded 320 times after 12 months, compared to a gold OA article being downloaded 917 times after 3 months (almost 3 times higher). This suggests that gold OA is contributing to accelerating the speed of knowledge discovery, enabling authors to engage with and build upon research more quickly.
Most importantly, on average a gold OA article after 3 months has been downloaded more often than a non-OA article after 12 months.
Table 2. Growth in the average number of downloads over time and according to access type
|
Access type |
Non-OA |
Green OA |
Gold OA |
|
|---|---|---|---|---|
|
Average downloads over time |
3 months |
148.39 |
182.14 |
917.47 |
|
6 months |
240.82 |
271.84 |
1,361.96 |
|
|
12 months |
320.03 |
415.54 |
2,101.31 |
|
|
Predicted downloads over time |
3 months |
149.61 |
186.96 |
977.31 |
|
6 months |
241.69 |
280.27 |
1,444.25 |
|
|
12 months |
320.74 |
431.11 |
2,223.75 |
|

Gold OA supports greater equity with increased access in low-income and lower-middle-income countries
As well as gold OA articles achieving more downloads than green OA articles and non-OA articles, they also support greater equity with a wider global readership. In particular, gold OA articles are reaching further into LICs and LMICs.
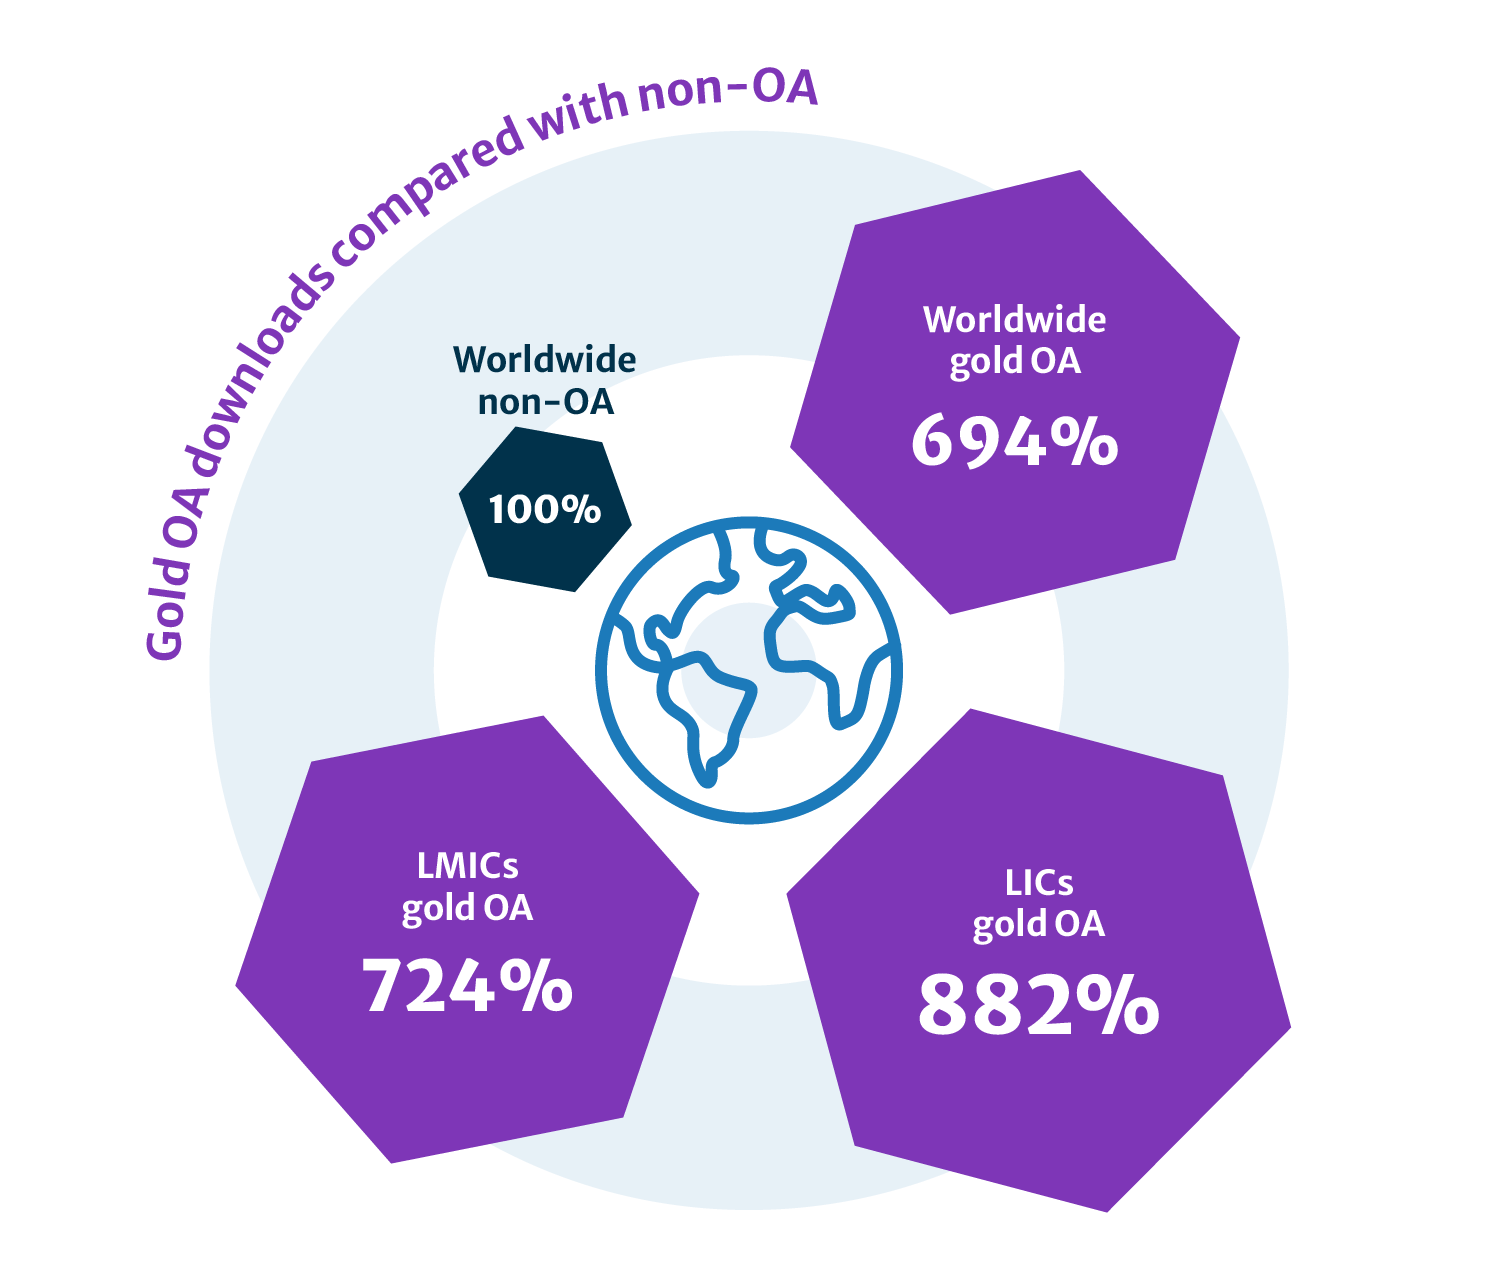
Whilst gold OA maintains its advantage globally, the increase is more striking in LMICs, and higher still for LICs. Gold OA articles were found to have 7.24 times higher downloads (or 724%) across LMICs than non-OA articles, and 8.82 times higher downloads (or 882%) across LICs than non-OA articles. This demonstrates how gold OA can broaden access by reducing barriers to peer-reviewed research for everyone to read, share and build on.
Whilst gold OA maintains its advantage globally, the increase is more striking in LMICs, and higher still for LICs.
Table 3. Usage by country income
|
Economic status |
LMICs |
LICs |
Worldwide |
|
|---|---|---|---|---|
|
Downloads per article |
Non-OA |
56.49 |
1.35 |
611.32 |
|
Green OA |
42.48 |
1.00 |
813.59 |
|
|
Gold OA |
408.73 |
11.95 |
4,243.68 |
|
|
Comparison to non-OA (%) |
Non-OA |
100.00% |
100.00% |
100.00% |
|
Green OA |
75.20% |
74.11% |
133.09% |
|
|
Gold OA |
723.59% |
882.08% |
694.18% |
|

Gold OA articles receive 50% more citations than green OA and non-OA articles
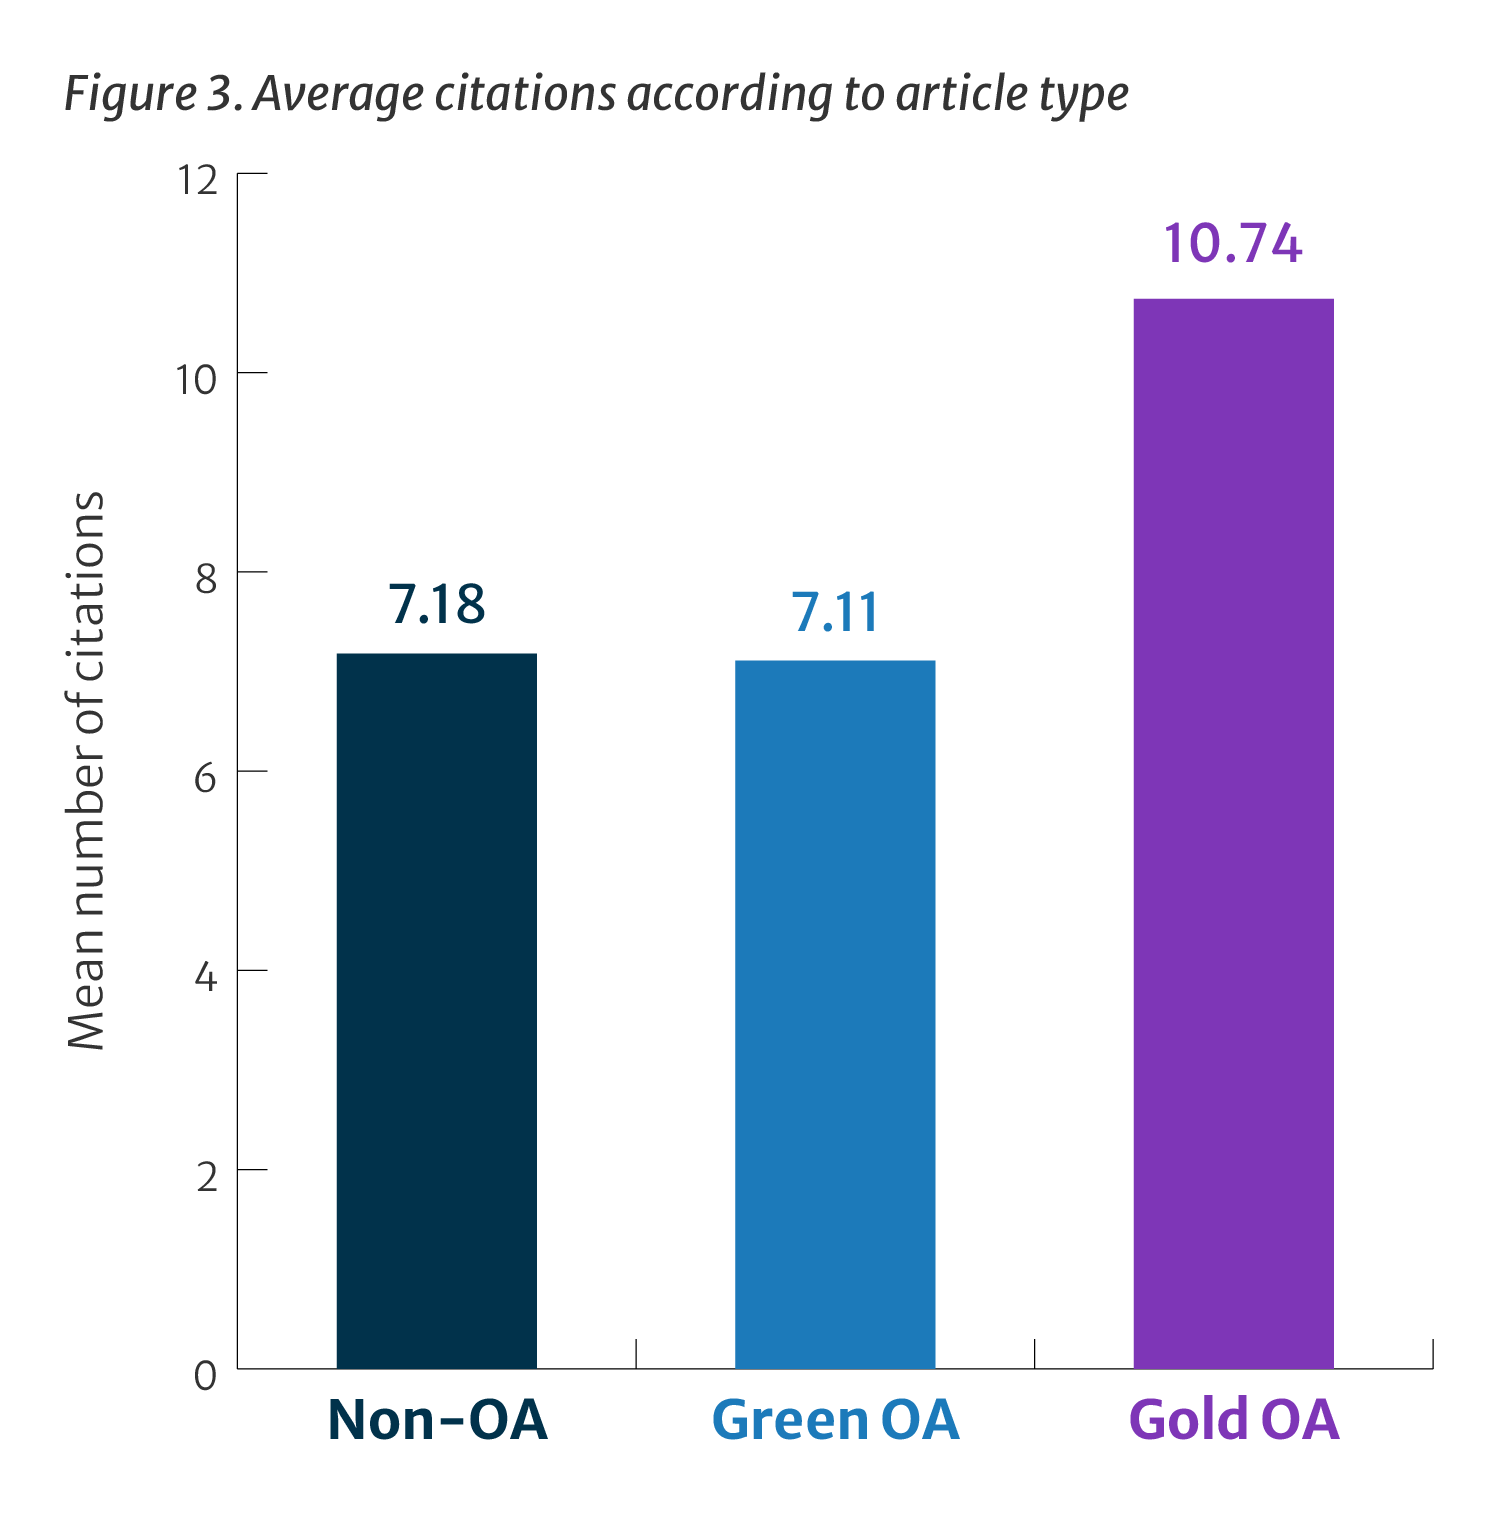
The citation advantage of gold OA articles over green OA articles and non-OA articles can also be seen in both the mean and the predicted number of citations. Whereas non-OA articles and green OA articles have just over 7 citations on average, gold OA articles have 10.74 citations per article. That’s around 1.5 times (150%) as many citations on average, delivering greater value for researchers. The model predicts an even higher number of citations, with 1.7 times (170%) as many citations for gold OA articles.
Although green OA articles received fewer citations than non-OA articles on average, potentially reflecting researchers' preference for citing the VOR rather than an openly available manuscript version, this relationship reverses in the predictive model. After accounting for other variables, green OA articles are predicted to receive 14% more citations than non-OA articles. Nevertheless, this advantage is considerably smaller than that associated with gold OA, suggesting that researchers continue to favour the VOR, even when a green OA alternative is accessible.
Once again, the numbers seen in this study broadly follow those in the Going for Gold white paper published in 2021, indicating a continued OA advantage despite changes in both the underlying data set and scholarly publishing over the past 5 years.20
Researchers continue to favour the VOR, even when a green OA alternative is accessible.
Table 4. Average number of citations by article type
|
Access type |
Non-OA |
Green OA |
Gold OA |
|---|---|---|---|
|
Number of articles |
145,189 |
11,494 |
48,098 |
|
Mean number of citations |
7.18 |
7.11 |
10.74 |
|
Mean (%) |
100.00 |
99.09 |
149.75 |
|
Median |
4 |
4 |
6 |
|
Prediction |
7.71 |
8.76 |
13.13 |
|
Prediction (%) |
100.00 |
113.52 |
170.23 |
20 Emery et al. (2021). See #2

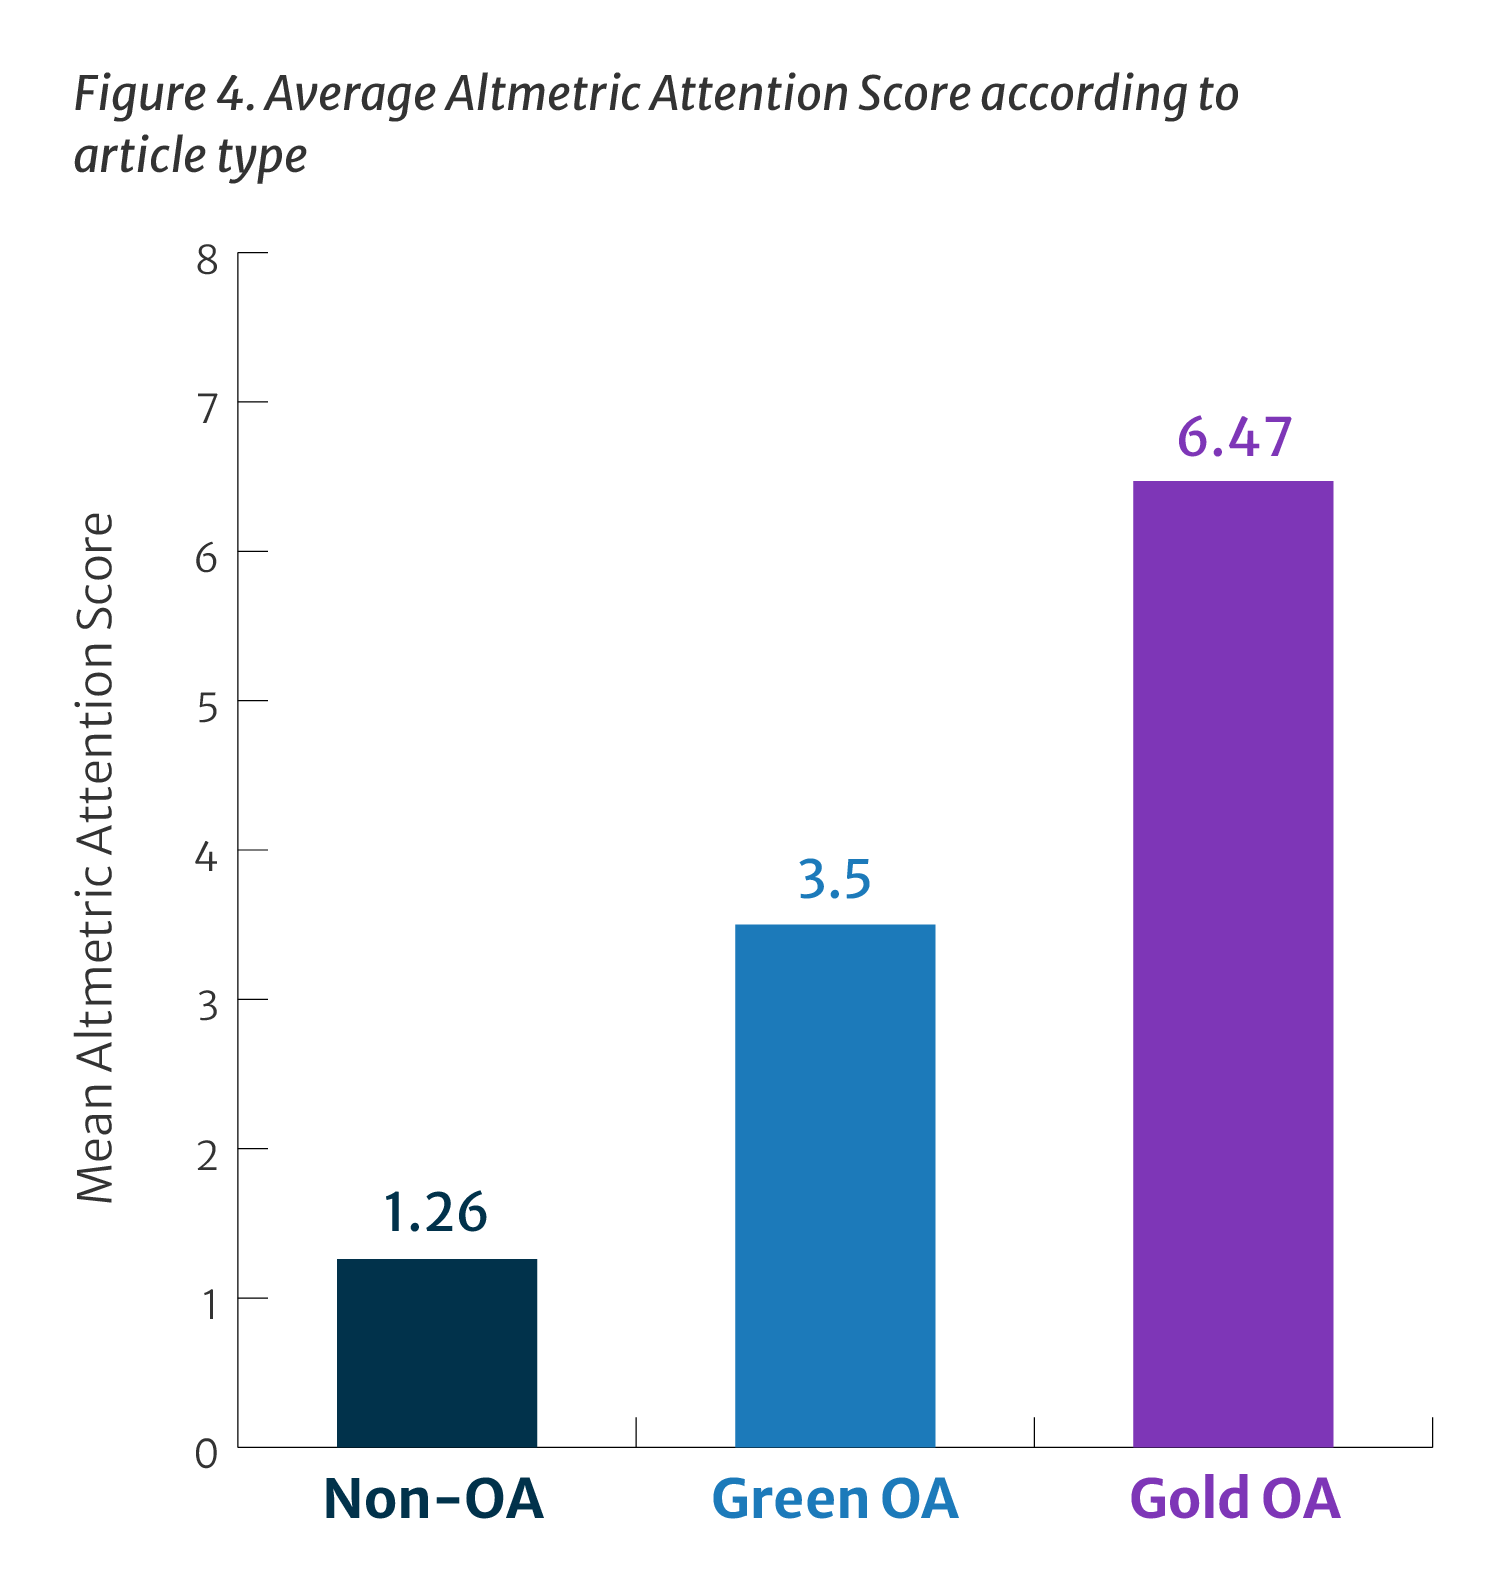
Gold OA articles receive over 5 times higher an Altmetric score than non-OA articles and 1.85 times higher than green OA
The Altmetric score also reflects the OA advantage, with gold OA articles having a higher Altmetric score on average than both non-OA articles and green OA articles.
Gold OA articles have an average Altmetric score of 6.47, which is 5.12 times higher (or 512%) than non-OA articles, which average an Altmetric score of 1.26. Green OA articles also average a higher Altmetric score than non-OA articles, 3.50, although this is considerably lower than the gold OA advantage. This data demonstrates that gold OA amplifies the broader reach and influence of research beyond academia.
The predicted advantage of gold OA articles and green OA articles over non-OA articles is even higher. Green OA articles are predicted to have 3.61 times higher an Altmetric score (or 361%) on average than non-OA articles, and gold OA articles are predicted to have 6.26 times higher an Altmetric score (or 626%).
As with the number of downloads and citations, the Altmetric score trends broadly follow those in the Going for Gold white paper.21
This data demonstrates that gold OA amplifies the broader reach and influence of research beyond academia.
Table 5. Average Altmetric Attention Score by article type
|
Access type |
Non-OA |
Green OA |
Gold OA |
|---|---|---|---|
|
Number of articles |
145,189 |
11,494 |
48,098 |
|
Mean |
1.26 |
3.50 |
6.47 |
|
Mean (%) |
100.00 |
276.90 |
512.32 |
|
Median |
0 |
0 |
1 |
|
Prediction |
1.27 |
4.31 |
7.93 |
|
Prediction (%) |
100.00 |
340.60 |
626.50 |
21 Emery et al. (2021). See #2

 Built with Shorthand