Intentions to
publish null
results in a journal

4.1 Factors influencing willingness to publish null results
Less than half of respondents (46%) said that they would be somewhat or very likely to write a journal article based on null results generated during a future research project, with 35% somewhat or very unlikely, and 20% unsure (n=11,069, with percentages rounded up to the nearest whole number).
Unsurprisingly, those who feel it is important that researchers share null results by any channel, and those who have previously submitted a null-results based manuscript, are the most likely to expect that they will write a journal article based on null results in the near future.
4.2 Variations by discipline, region, and career stage
There was also a general observation of a positive relationship between perceived importance of sharing null results and the willingness to do so. Responses varied by subject area, as disciplines which place greater importance on null results sharing are also more likely to be willing to share null results.
For example, researchers in Medicine – who are the most likely to feel sharing null results is important and to have submitted a null results-based manuscript previously – are also the most likely to anticipate that they would write a null-results based manuscript in the future (56%).
Figure 11: Future likelihood of publishing null results in a journal varies by subject area


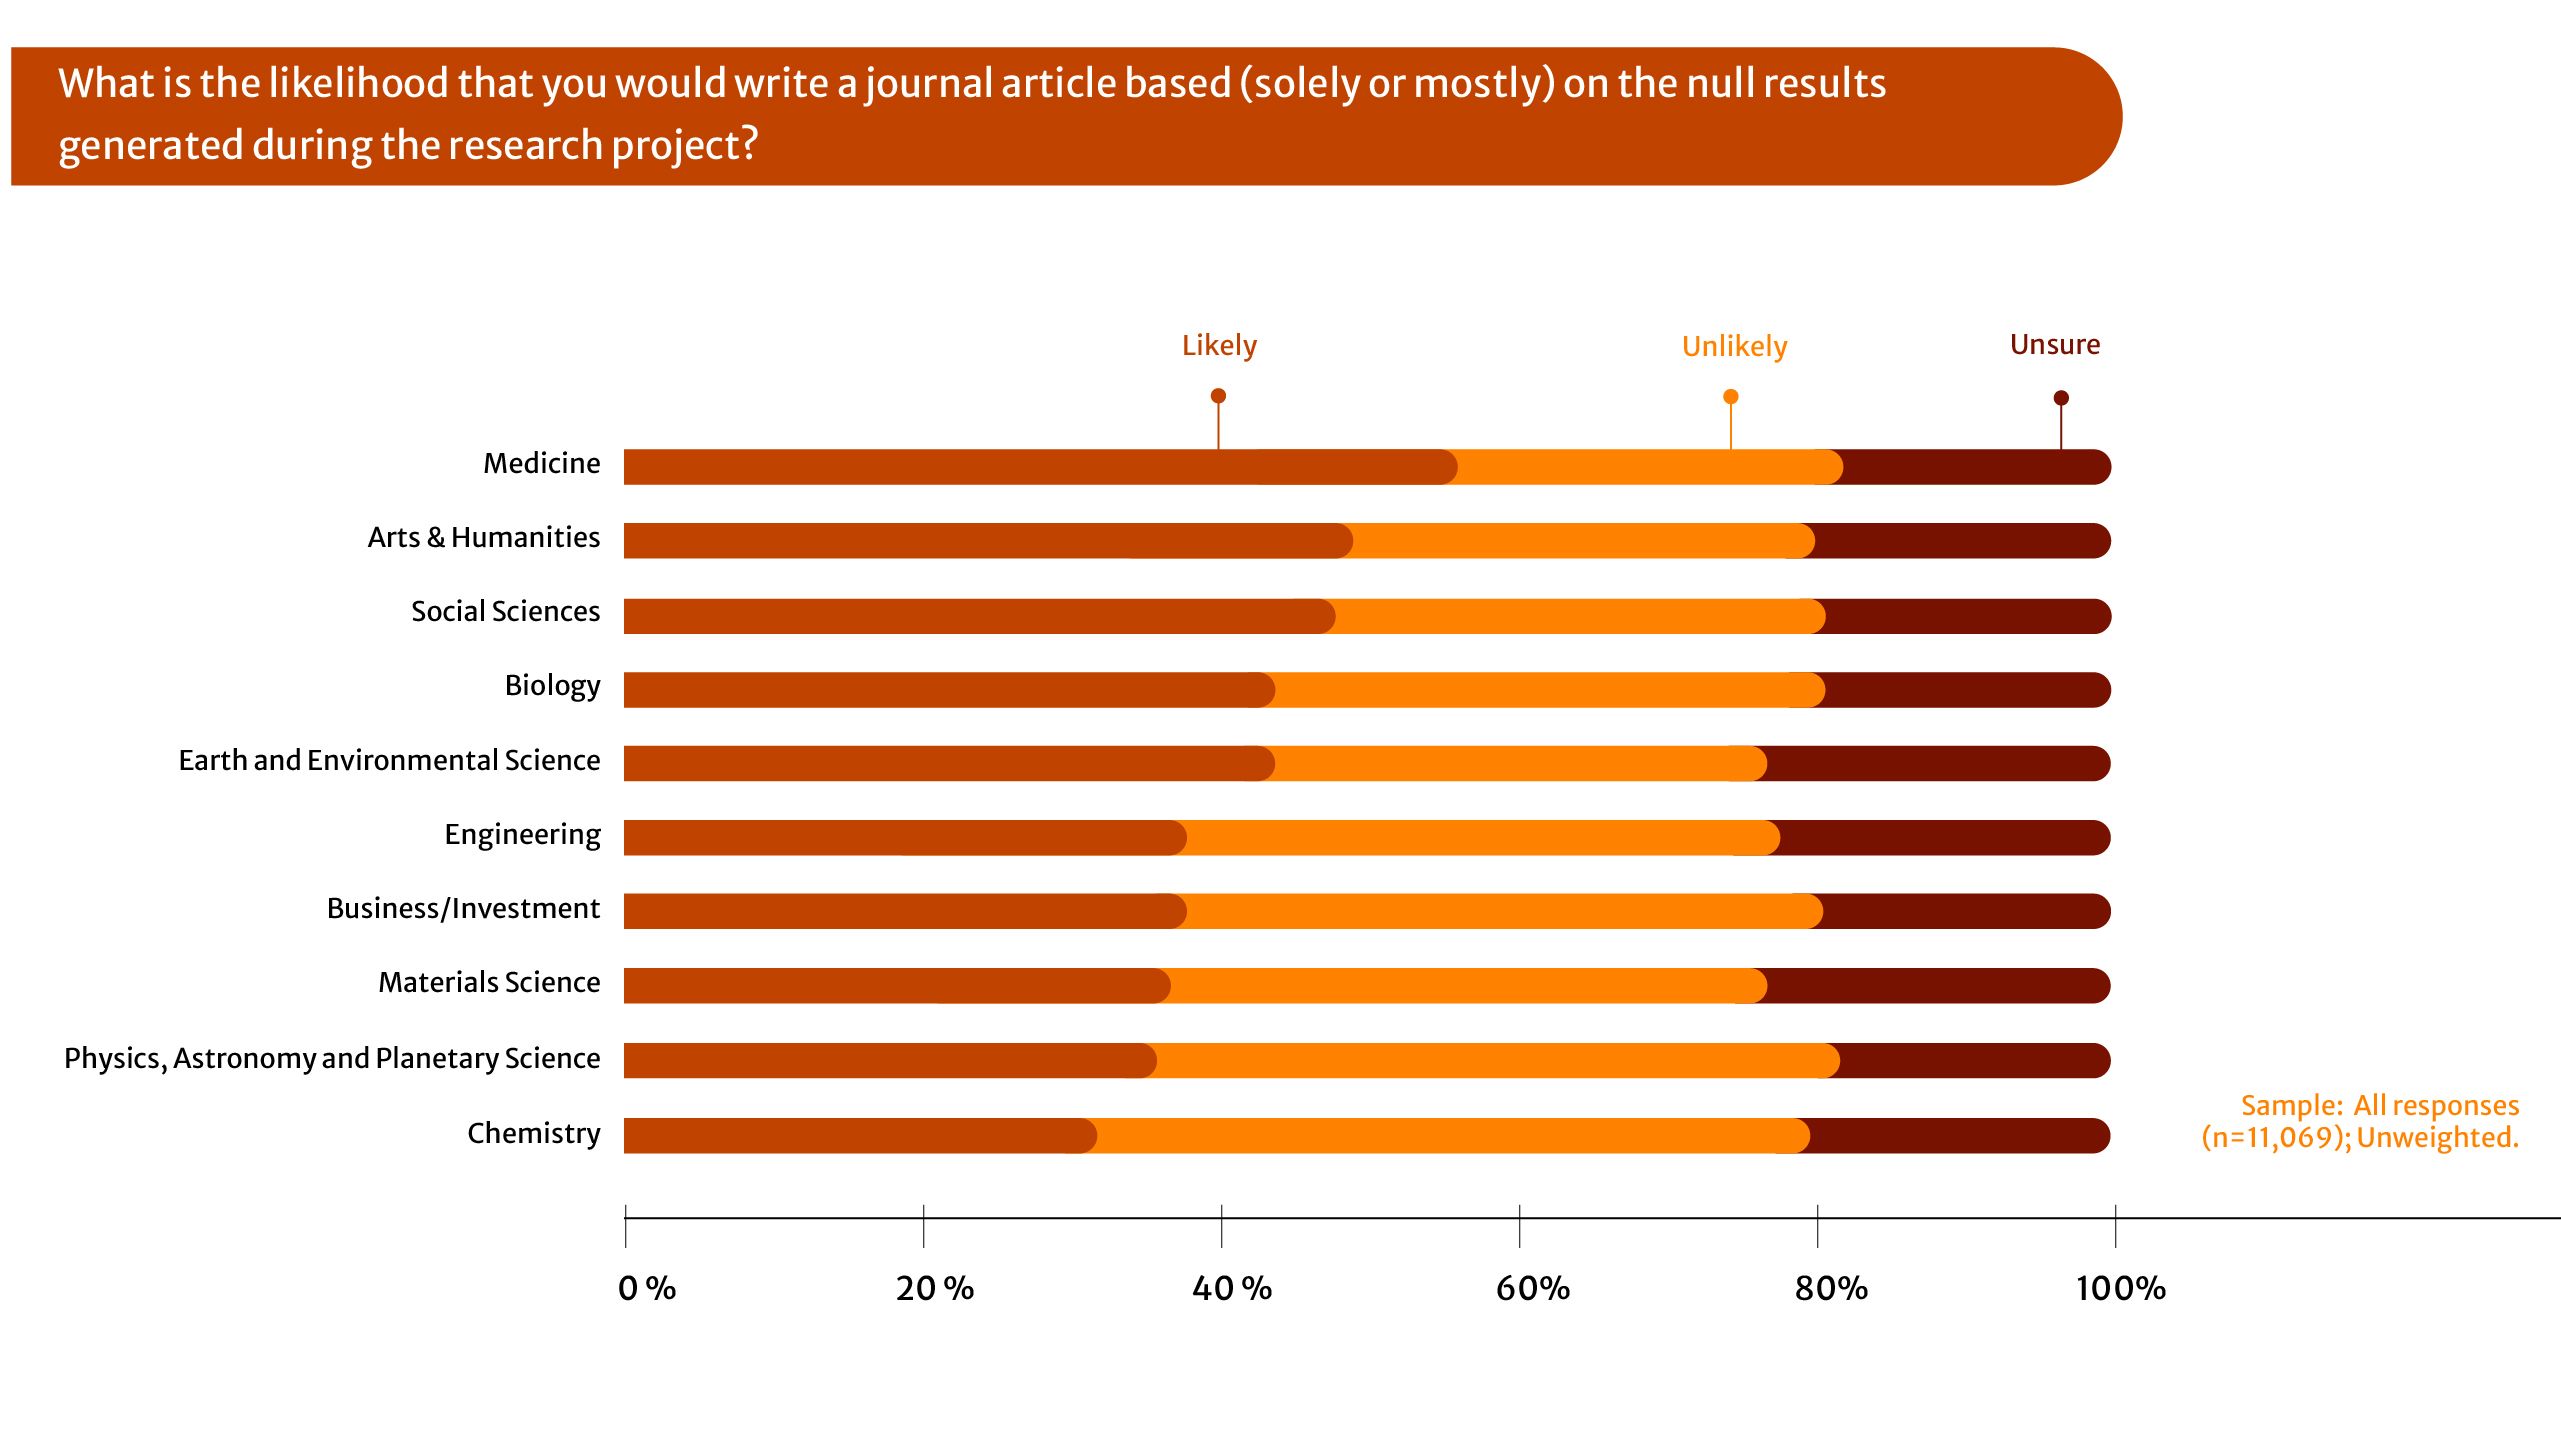
Table 11: Future likelihood of publishing null results in a journal varies by subject area
|
What is the likelihood that you would write a journal article based (solely or mostly) on the null results generated during the research project? |
||||||||||
|---|---|---|---|---|---|---|---|---|---|---|
|
Medicine |
Arts & Humanities |
Social Sciences |
Earth and Environmental Science |
Biology |
Materials Science |
Engineering |
Business/ |
Physics, Astronomy and Planetary Science |
Chemistry |
|
|
net likely ("Very likely" + "Somewhat likely") |
56% |
49% |
48% |
44% |
44% |
37% |
38% |
38% |
36% |
32% |
|
Very likely |
25% |
20% |
20% |
16% |
15% |
9% |
11% |
10% |
12% |
9% |
|
Somewhat likely |
31% |
30% |
28% |
28% |
28% |
28% |
26% |
27% |
24% |
23% |
|
Unsure |
18% |
20% |
19% |
23% |
19% |
23% |
22% |
19% |
18% |
20% |
|
Somewhat unlikely |
17% |
16% |
19% |
21% |
21% |
21% |
22% |
19% |
22% |
24% |
|
Very unlikely |
9% |
15% |
14% |
12% |
16% |
18% |
19% |
24% |
24% |
23% |
|
net unlikely ("Very unlikely" + "Somewhat unlikely") |
26% |
31% |
33% |
33% |
37% |
40% |
40% |
43% |
46% |
48% |
|
net |
30 |
18 |
15 |
12 |
7 |
-2 |
-3 |
-6 |
-10 |
-16 |
|
Column n |
2928 |
325 |
1469 |
921 |
2269 |
425 |
1368 |
181 |
686 |
497 |
Sample: All responses (n=11,069); Unweighted.
Looking at responses by region, the anticipated likelihood of submitting an article based on null results to a journal is greatest in India (59%), Africa (54%), Latin America (51%), and the UK (48%). Japan and China were the least likely countries to submit a manuscript based on null results (27% and 39% respectively).
Figure 12: Future likelihood of publishing null results in a journal varies by region

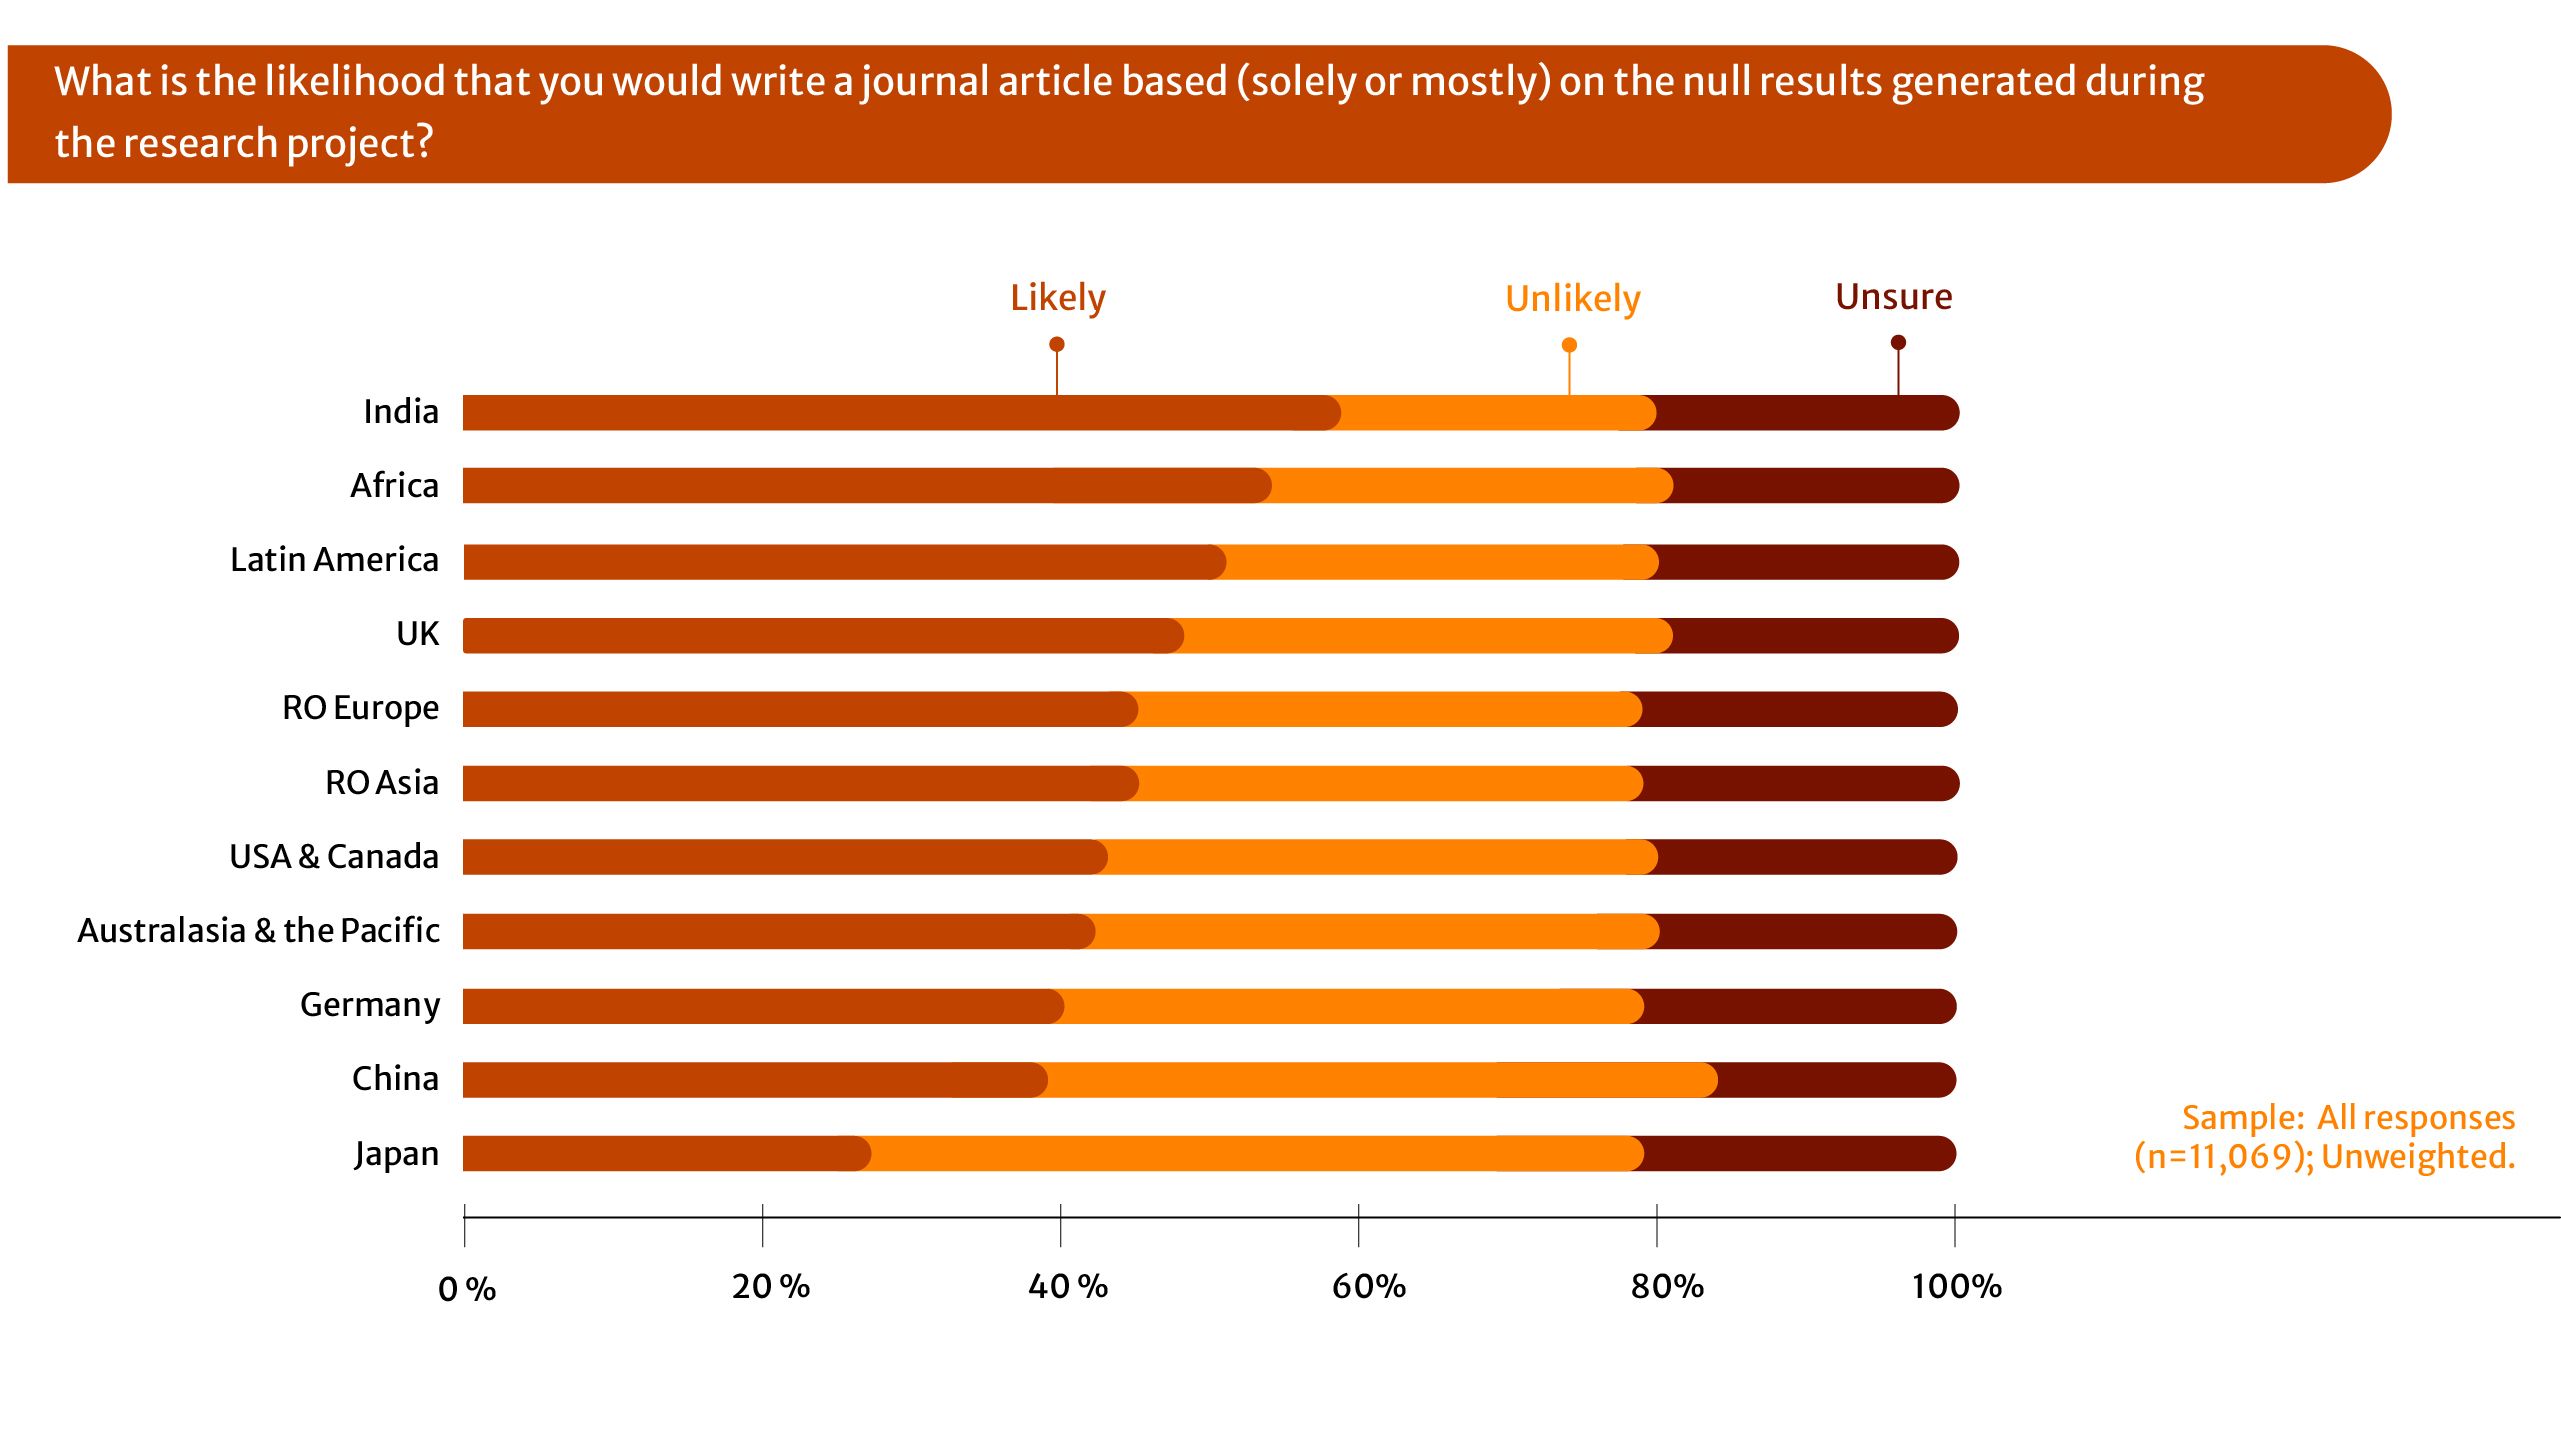
Table 12: Future likelihood of publishing null results in a journal varies by region
|
What is the likelihood that you would write a journal article based (solely or mostly) on the null results generated during the research project? |
|||||||||||
|---|---|---|---|---|---|---|---|---|---|---|---|
|
India |
Africa |
Latin America |
UK |
RO Asia |
RO Europe |
Australasia & the Pacific |
USA + Canada |
Germany |
China |
Japan |
|
|
net likely ("Very likely" + "Somewhat likely") |
59% |
54% |
51% |
48% |
45% |
45% |
42% |
43% |
40% |
39% |
27% |
|
Very likely |
25% |
26% |
21% |
21% |
16% |
18% |
20% |
15% |
15% |
8% |
9% |
|
Somewhat likely |
33% |
28% |
30% |
27% |
30% |
27% |
22% |
27% |
25% |
31% |
18% |
|
Unsure |
20% |
19% |
21% |
19% |
21% |
20% |
20% |
20% |
21% |
15% |
21% |
|
Somewhat unlikely |
13% |
11% |
15% |
16% |
19% |
18% |
22% |
21% |
23% |
36% |
26% |
|
Very unlikely |
9% |
16% |
13% |
16% |
15% |
16% |
16% |
16% |
16% |
9% |
26% |
|
net unlikely ("Very unlikely" + "Somewhat unlikely") |
21% |
27% |
29% |
33% |
34% |
34% |
38% |
37% |
39% |
45% |
52% |
|
net anticipated likelihood |
37 |
28 |
22 |
16 |
12 |
11 |
4 |
5 |
1 |
-6 |
-26 |
|
Column n |
723 |
882 |
807 |
467 |
1256 |
3173 |
272 |
1596 |
445 |
1153 |
292 |
Sample: All responses (n=11,069); Unweighted.
The seniority of the researcher did not affect responses, with similar levels of respondents saying they were likely to submit: 44% early career researchers, 48% mid-career researchers and 45% senior career researchers. Whether they were unlikely or unsure followed a similar pattern.