Introduction

Since their adoption in 2015, the SDGs have become both a global policy framework and a key driver of research, innovation, and collaboration. Universities and research institutions increasingly embed the SDGs into strategy, aligning research agendas with global priorities for sustainable development. v,vi For publishers, including Springer Nature, the Goals have provided a strategic focus to amplify research impact, with new journals, books, and collections dedicated to SDG topics, engagement programmes, and partnerships that highlight how science contributes to solving urgent challenges.vii
The shape of SDG research
Today, SDG-related work represents a significant and fast-growing share of global research. In 2024, SDG-related articles accounted for approximately 24% of all research published. Since 2000, SDG-aligned research has consistently grown faster than the broader market. Importantly, this is not solely the effect of the SDGs themselves: analysis of compound annual growth rates (CAGRs) shows this trend began before the SDGs were adopted in 2015. While growth has accelerated since 2016, the data show a continuation, rather than a marked increase driven by the SDGs’ introduction, for most of the 17 Goals (Fig. 1).
Figure 1: Compound annual growth rate (CAGR) by SDG and non-SDG research topics, 2000–2024

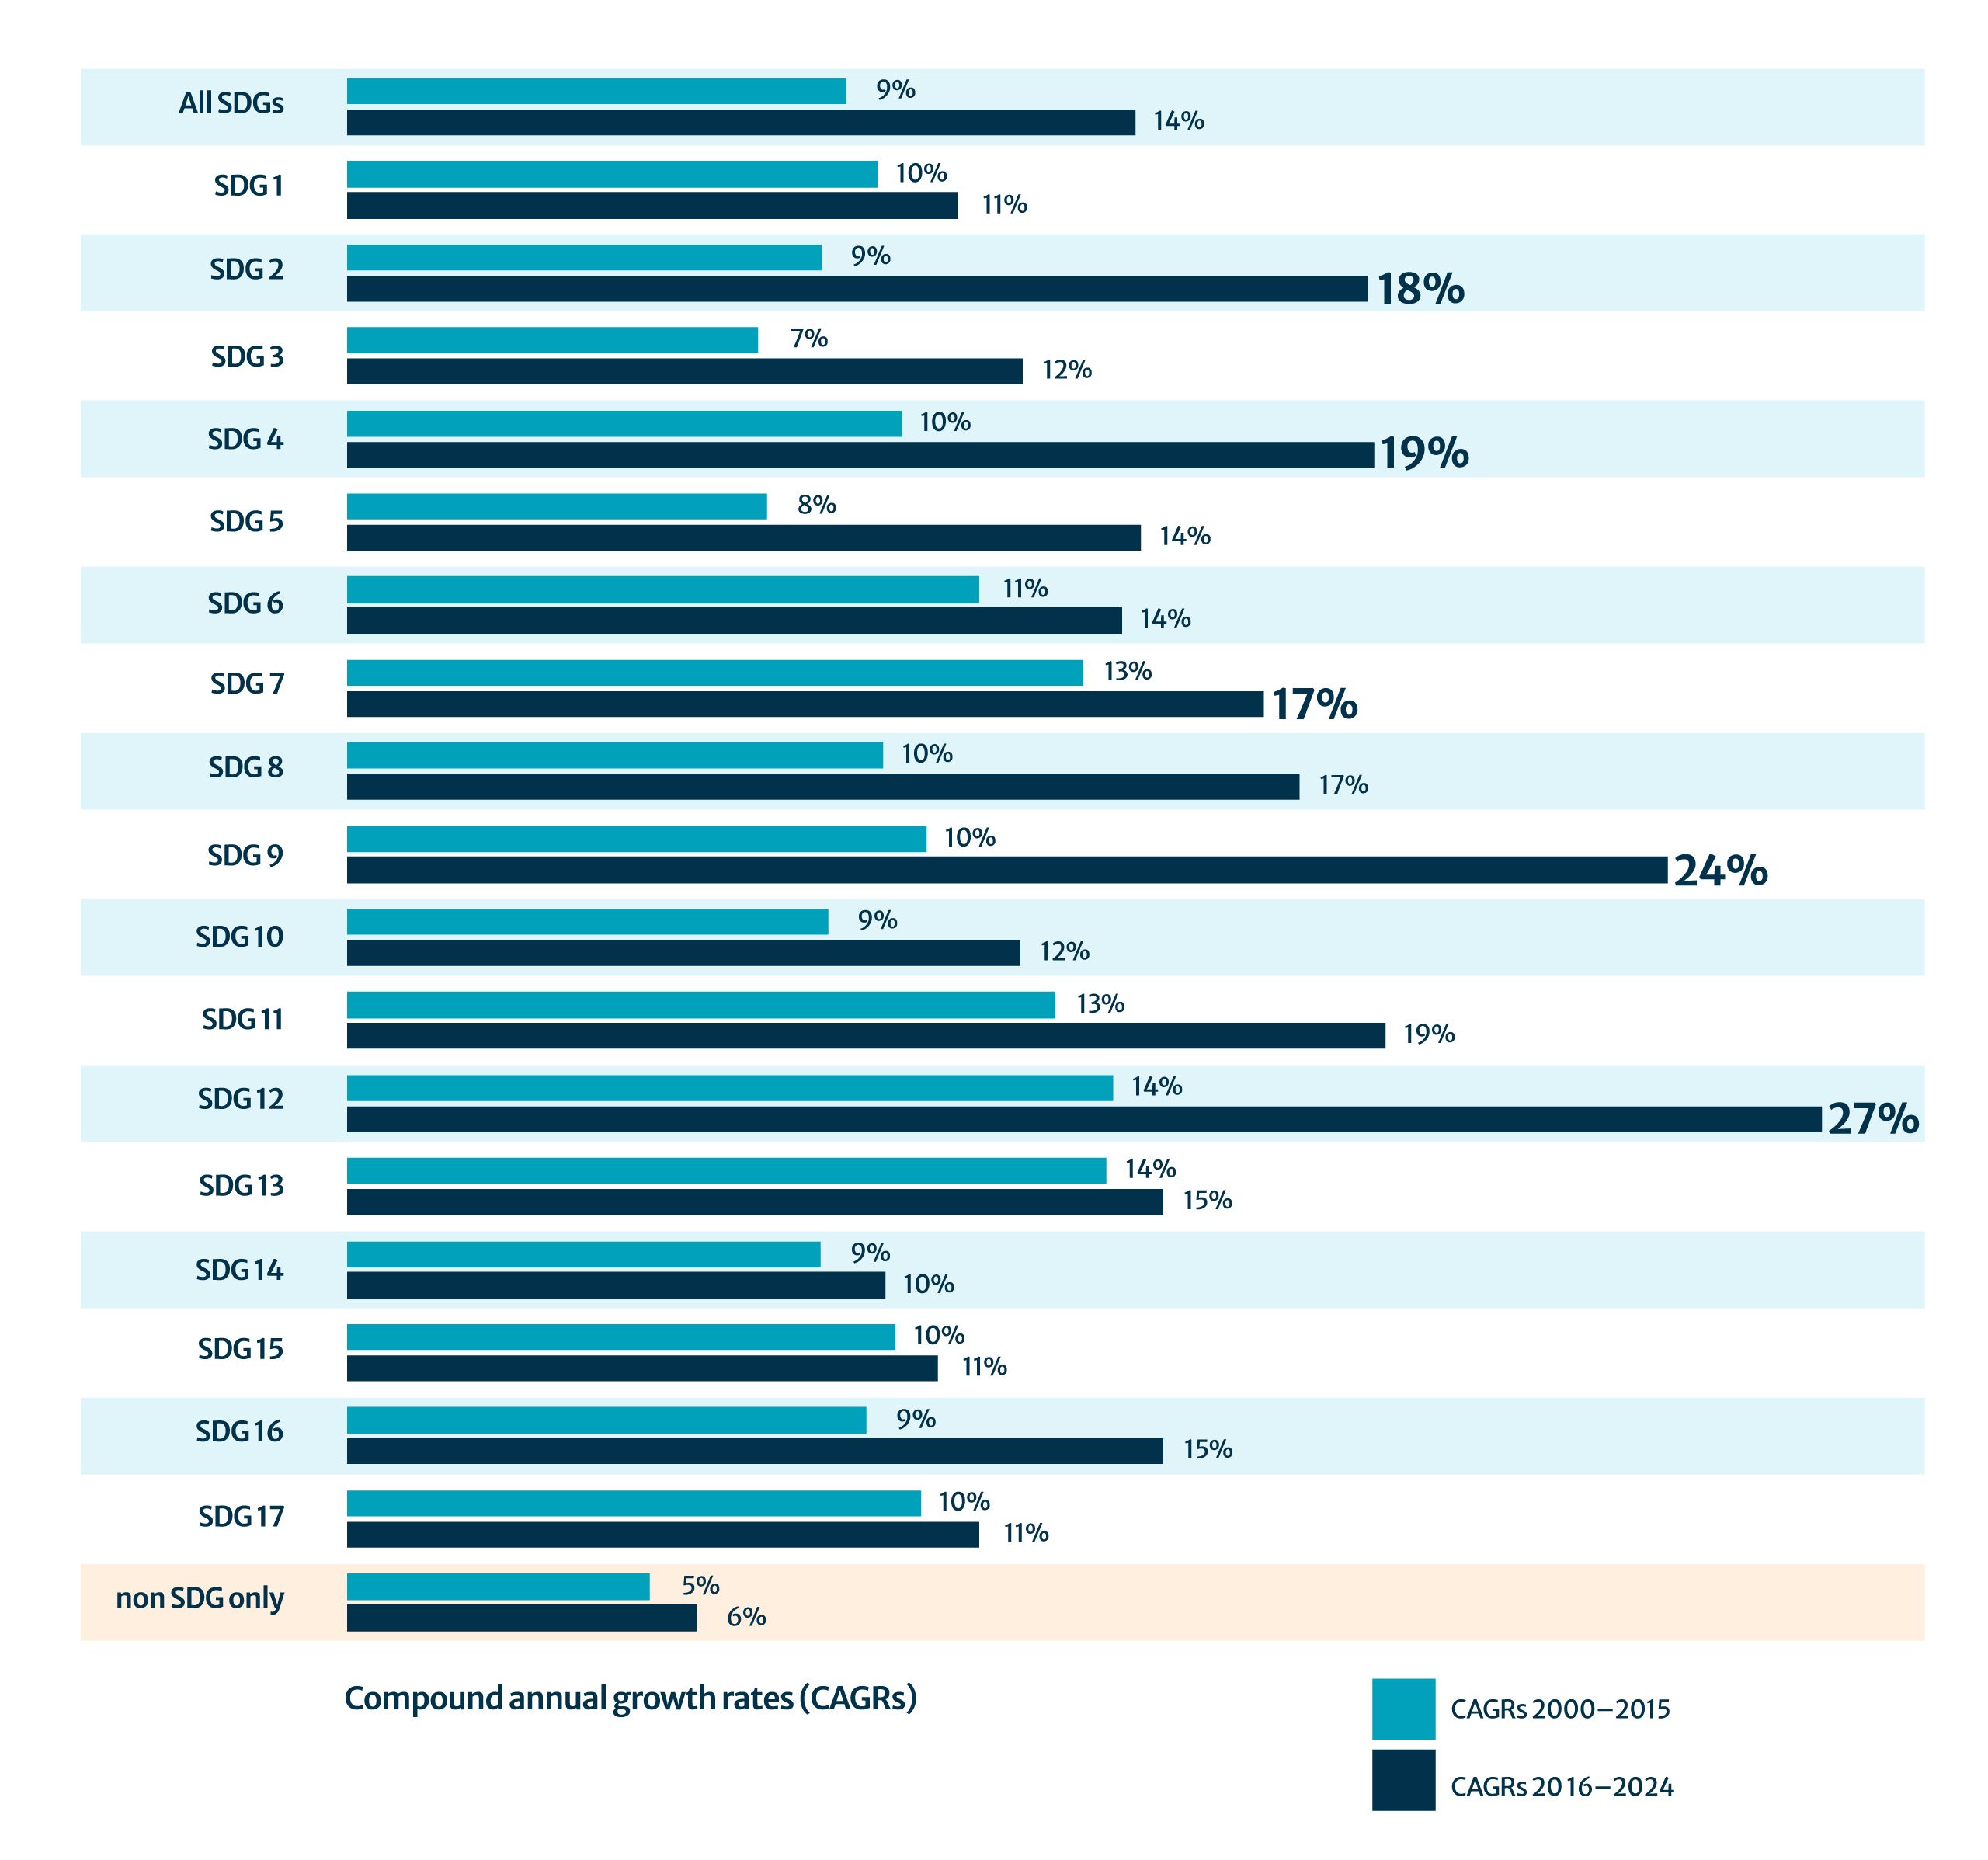
Compound annual growth rate (CAGR) by SDG and non-SDG research topics, 2000–2024
|
Research topic |
CAGRs 2000–2015 |
CAGRs 2016–2024 |
|---|---|---|
|
All SDGs |
9% |
14% |
|
SDG 1 |
10% |
11% |
|
SDG 2 |
9% |
18% |
|
SDG 3 |
7% |
12% |
|
SDG 4 |
10% |
19% |
|
SDG 5 |
8% |
14% |
|
SDG 6 |
11% |
14% |
|
SDG 7 |
13% |
17% |
|
SDG 8 |
10% |
17% |
|
SDG 9 |
10% |
24% |
|
SDG 10 |
9% |
12% |
|
SDG 11 |
13% |
19% |
|
SDG 12 |
14% |
27% |
|
SDG 13 |
14% |
15% |
|
SDG 14 |
9% |
10% |
|
SDG 15 |
10% |
11% |
|
SDG 16 |
9% |
15% |
|
SDG 17 |
10% |
11% |
|
non-SDG only |
5% |
6% |
Notably, the SDGs with the strongest increases in growth post-2015 represent global challenges that were already well established, with roots in the earlier Millennium Development Goals (SDG 2: Zero Hunger; SDG 4: Quality Education; SDG 5: Gender Equality) or addressing systemic elements of global sustainability (SDG 7: Affordable and Clean Energy; SDG 9: Industry, Innovation and Infrastructure and SDG 12: Responsible Consumption and Production).
Regionally, SDG research output has grown fastest in Africa, China, India, and elsewhere in Asia. In these regions, SDG article growth consistently outpaces that of non-SDG articles, particularly after 2015. However, no region shows a statistically significant shift that can be directly attributed to the SDGs’ adoption (Table 1).
Table 1: CAGRs of SDG vs all research by region/country
|
|
Time period |
United States |
United Kingdom |
Germany |
Europe excluding UK and Germany |
South America |
Africa |
India |
China |
Asia excluding China and India |
|---|---|---|---|---|---|---|---|---|---|---|
|
SDG articles |
2000 - 2015 |
7% |
8% |
10% |
10% |
12% |
12% |
15% |
20% |
11% |
|
2016 - 2024 |
5% |
7% |
8% |
9% |
8% |
13% |
17% |
21% |
13% |
|
|
All articles CAGR |
2000 - 2015 |
4% |
4% |
4% |
5% |
10% |
11% |
12% |
15% |
6% |
|
2016 - 2024 |
2% |
3% |
2% |
4% |
4% |
10% |
10% |
12% |
6% |
SDG research impact in academia
SDG research is not only growing in volume but also demonstrates higher academic impact. Categorising Springer Nature articles published in 2024 by SDG and non-SDG-related topics, SDG articles received higher average citations, Altmetric scores (indicating attention),viii and full-text downloads than non-SDG articles (Fig. 2).3
Figure 2: Average research impact of Springer Nature SDG and non-SDG research, comparing citations, Altmetric scores, and downloads (2024)


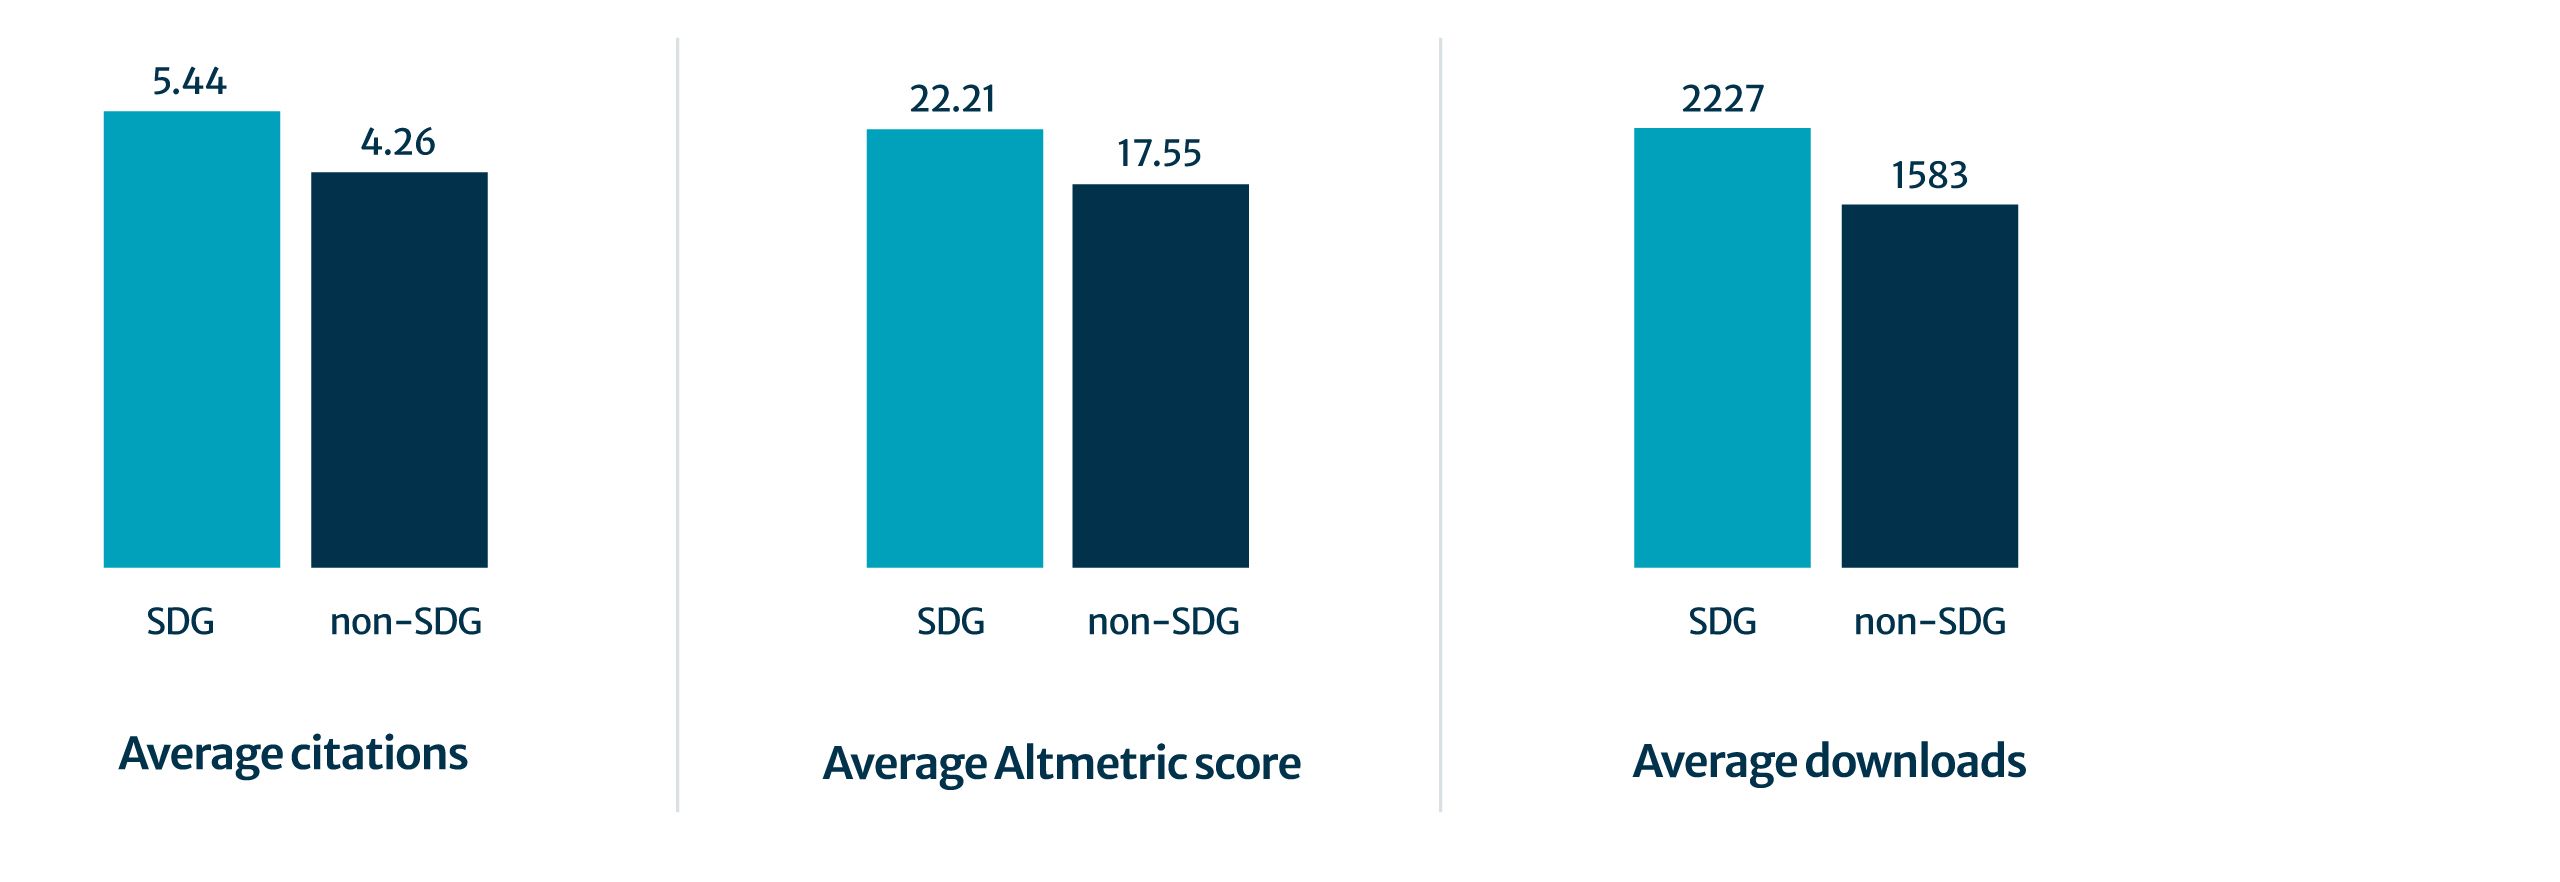
3 Compares lifetime data for all Springer Nature articles published in 2024. Data source: Springer Nature internal data and research analysis from https://www.dimensions.ai/
Average research impact of Springer Nature SDG and non-SDG research, comparing citations, Altmetric scores, and downloads (2024)
|
Average citations |
Average Altmetric score |
Average downloads |
|
|---|---|---|---|
|
SDG |
5.44 |
22.21 |
2227.27 |
|
non-SDG |
4.26 |
17.55 |
1583.14 |
This trend is also visible at the regional level. For example, China, now the largest contributor of SDG-tagged articles, has moved from one of the lowest average citation impacts in 2000 to the highest by 2022, with markedly higher citations to SDG articles. India and Africa also show improvements, with SDG articles outperforming non-SDG research in citation impact (Fig. 3).
Figure 3: Mean citations to SDG vs non-SDG articles by country/region (2000–2022)


Mean citations to SDG vs non-SDG articles by country/region (2000–2022)
|
Articles |
SDG articles |
non-SDG articles |
||||
|---|---|---|---|---|---|---|
|
Metric |
Citations (mean) to 2000 articles |
Citations (mean) to 2015 articles |
Citations (mean) to 2022 articles |
Citations (mean) to 2000 articles |
Citations (mean) to 2015 articles |
Citations (mean) to 2022 articles |
|
United States |
76 |
53 |
15 |
69 |
45 |
12 |
|
United Kingdom |
67 |
56 |
18 |
59 |
48 |
14 |
|
Germany |
63 |
56 |
18 |
49 |
41 |
12 |
|
China |
32 |
52 |
19 |
25 |
33 |
13 |
|
India |
32 |
33 |
13 |
29 |
25 |
10 |
|
Africa |
38 |
31 |
11 |
26 |
24 |
9 |
|
South America |
38 |
29 |
9 |
28 |
20 |
6 |
|
Europe exc. UK + Germany |
50 |
37 |
11 |
40 |
27 |
8 |
|
Asia exc. China + India |
36 |
33 |
10 |
34 |
25 |
7 |
The SDG policy landscape
Impact beyond academia is central to the SDGs. The UN’s 2030 Agenda calls for science to contribute to inclusive, sustainable development through action, not just theory. The UN’s 2016 Science for Sustainable Development policy brief explicitly references closer alignment between science and the SDGs, encouraging partnerships across science, policy, business, and civil society.ix
To understand how this ambition is being realised, we have partnered with Overton, the world’s largest curated database of policy documents and grey literature, designed to track how academic research influences real-world policy. Overton’s database, Overton Index, indexes 22 million documents from more than 2,700 sources worldwide, including outputs from governments, NGOs, think tanks, and IGOs such as the UN and WHO. These policy documents include white papers, policy briefs, technical reports, and legislative materials. Overton links these documents to the academic research that they cite, allowing us to see how research has influenced policy. It also links the policy documents to other documents in the database that cite them, allowing us to see the follow-on impact of those works.
Document classification and analysis
For this analysis, we examined documents published between 2015 and 2025 that were classified to at least one SDG and cited scholarly research.
SDG classification
Overton Index uses a multi-label, hierarchical classifier powered by ModernBERT to classify each policy document against the 169 specific, measurable SDG targets that underpin the 17 Goals. Documents are classified to SDGs based on their titles and LLM-generated descriptions. Each document can be matched to one or more targets, or not classified at all, either because they are not relevant to any Goal or lack the text and metadata needed for classification. For this analysis, we excluded any document without an LLM-generated description, as these documents do not have adequate information to be classified.
- Approximately 5.5M documents were classified to at least one SDG.
- Approximately 6.9M documents were not classified to an SDG.
To support thematic comparison, we also applied the Stockholm Resilience Centre’s “wedding cake” model to group Goals into three categories:
Economy
SDG 8: Decent Work and Economic Growth
SDG 9: Industry, Innovation and Infrastructure
SDG 10: Reduced Inequality
SDG 12: Responsible Consumption and Production
Society
SDG 1: No Poverty
SDG 2: Zero Hunger
SDG 3: Good Health and Well-being
SDG 4: Quality Education
SDG 5: Gender Equality
SDG 7: Affordable and Clean Energy
SDG 11: Sustainable Cities and Communities
SDG 16: Peace, Justice and Strong Institutions
Biosphere
SDG 6: Clean Water and Sanitation
SDG 13: Climate Action
SDG 14: Life Below Water
SDG 15: Life on Land
Document classification
Overton Index identifies when a policy document cites academic research by extracting references and matching them to scholarly publications indexed in Crossref. It also identifies when a policy document cites other policy documents in the Overton database.
Citation patterns were analysed by country, document source type, and access model to explore how research informs SDG-related policy around the world.
Further detail on the methodology can be found in the Appendix.
The percentage of SDG-classified policy documents remains stable year on year
Since the adoption of the SDGs in 2015, the proportion of policy documents classified to at least one SDG has remained relatively stable year on year. This could indicate that the introduction of the SDGs has not shifted policy priorities but rather offers a way of categorising and assessing how existing priorities contribute to sustainable development (Fig. 5). While Overton Index’s data coverage is less comprehensive in the period 2000–2015, the proportion of SDG-related policy appears to be consistent.
Figure 4: Percentage of policy documents relating to an SDG, 2000–2025


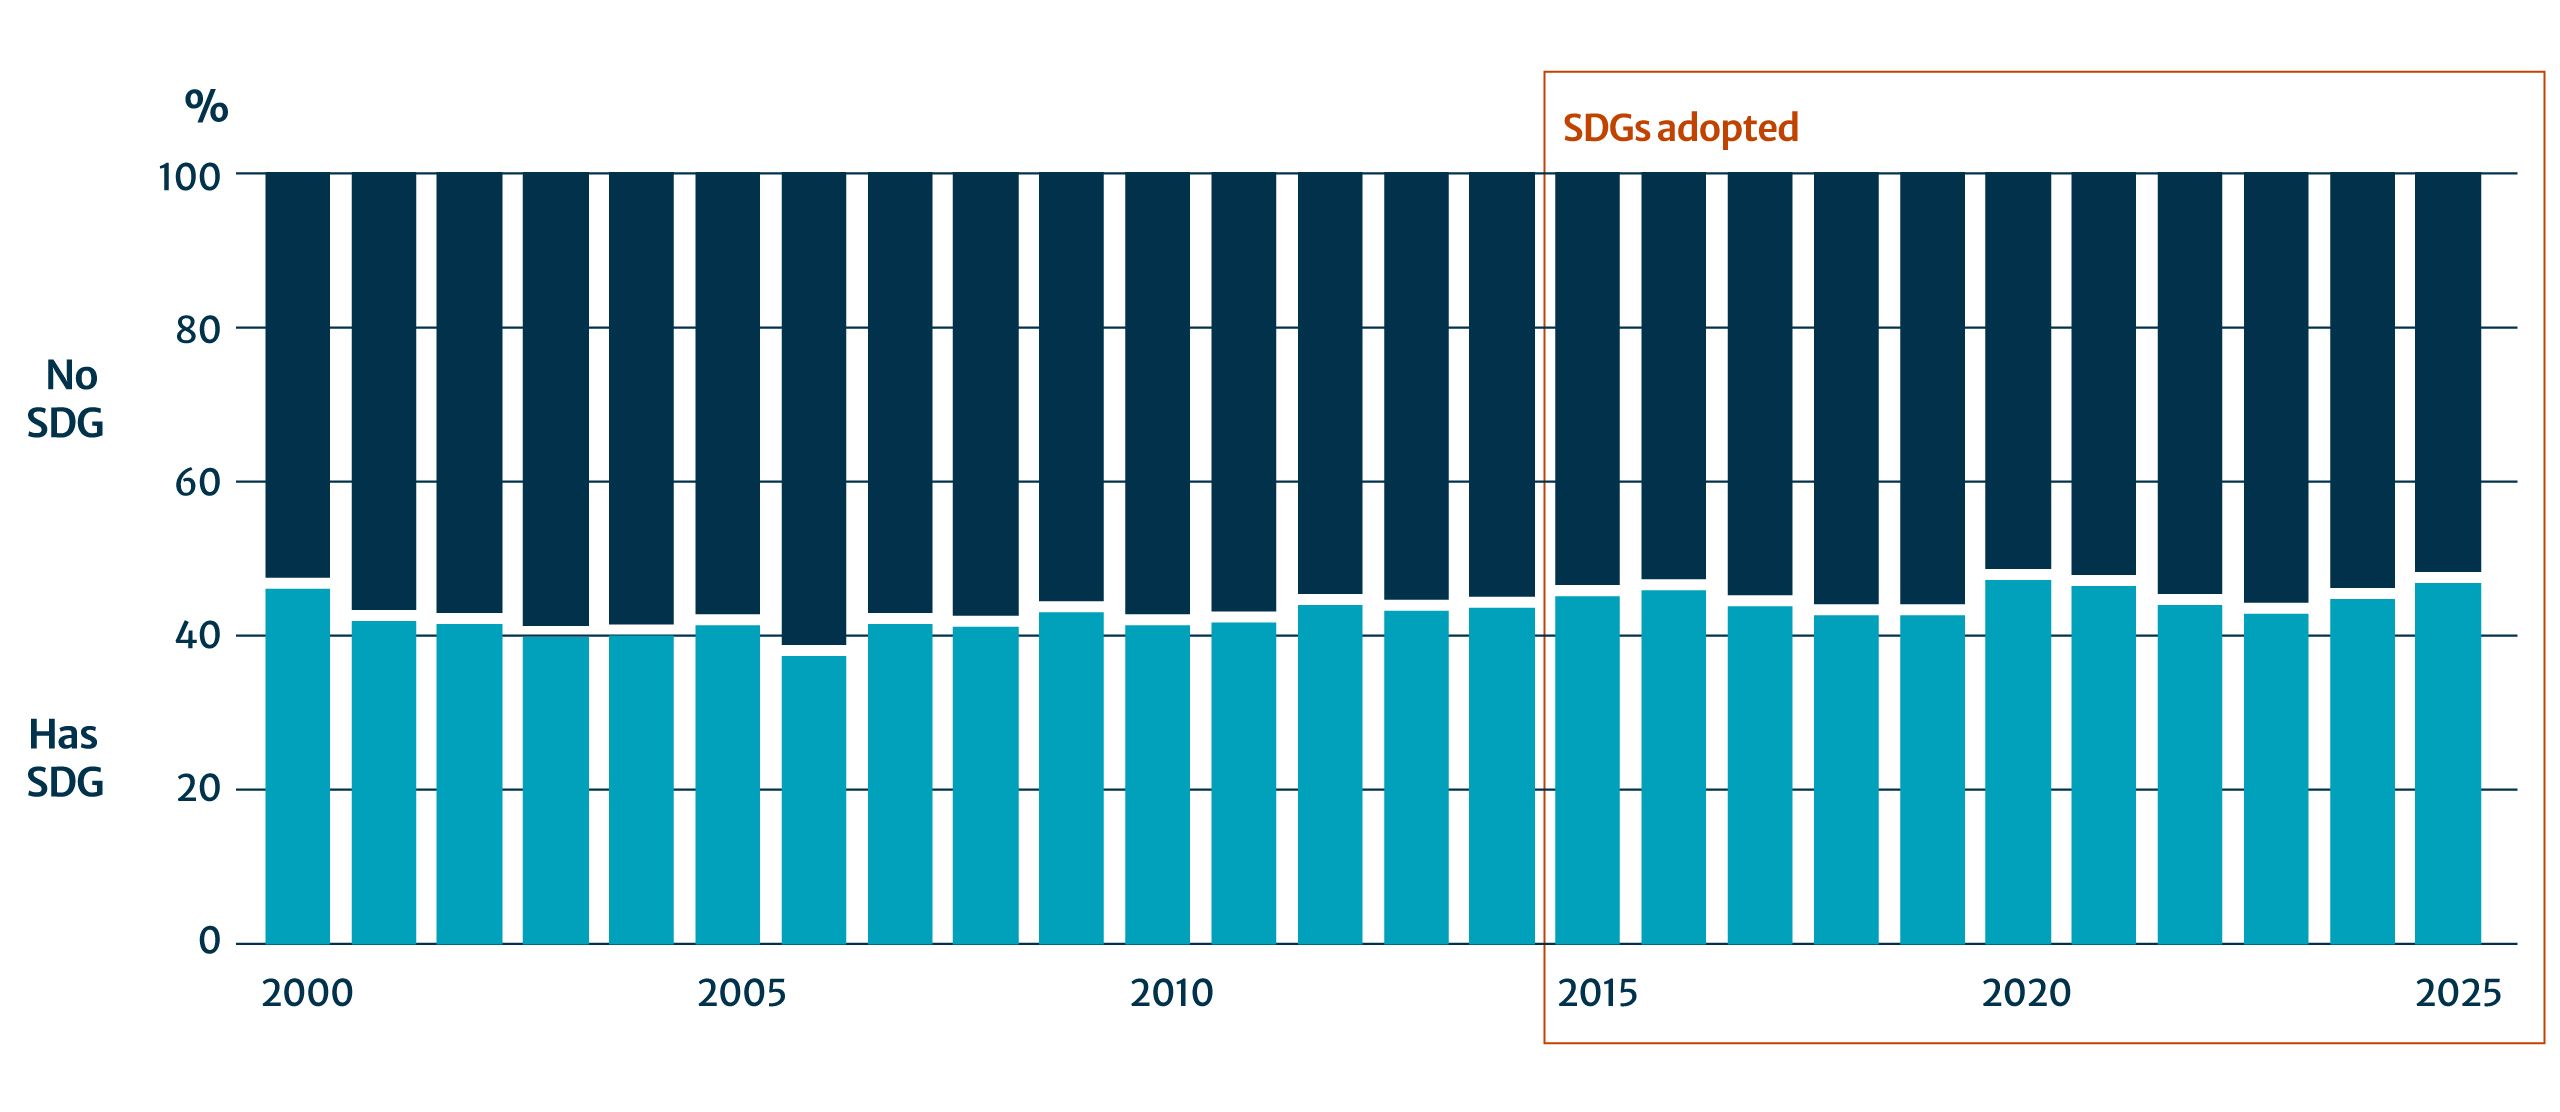
This figure shows the annual percentage of policy documents published between 2000 and 2025 that were classified as relating to at least one Sustainable Development Goal (SDG). Classification is based on Overton’s SDG taxonomy applied to each document. Documents with no SDG classification are shown as “No SDG.” Unlike other figures in this report, which generally focus on the post-2010 period, this figure extends further back to 2000 to illustrate trends leading up to the formal adoption of the SDGs in 2016. Percentages are calculated as the share of documents in each year with (or without) an SDG classification, relative to the total number of policy documents published in that year.
Percentage of policy documents relating to an SDG, 2000–2025
|
year |
Has SDG |
No SDG |
|---|---|---|
|
2000 |
46 |
54 |
|
2001 |
42 |
58 |
|
2002 |
41 |
59 |
|
2003 |
40 |
60 |
|
2004 |
40 |
60 |
|
2005 |
41 |
59 |
|
2006 |
37 |
63 |
|
2007 |
42 |
58 |
|
2008 |
41 |
59 |
|
2009 |
43 |
57 |
|
2010 |
41 |
59 |
|
2011 |
42 |
58 |
|
2012 |
44 |
56 |
|
2013 |
43 |
57 |
|
2014 |
44 |
56 |
|
2015 |
45 |
55 |
|
2016 |
46 |
54 |
|
2017 |
44 |
56 |
|
2018 |
43 |
57 |
|
2019 |
43 |
57 |
|
2020 |
47 |
53 |
|
2021 |
46 |
54 |
|
2022 |
44 |
56 |
|
2023 |
43 |
57 |
|
2024 |
45 |
55 |
|
2025 |
47 |
53 |
This pattern connects with research publication trends, where SDG-related article output has been increasing at a higher rate than the market since before 2015. Together, these findings suggest that the introduction of the SDGs has reinforced – not redirected – existing areas of activity in research or policy.
v Sustainable Development Solutions Network. (n.d.). Our networks. https://www.unsdsn.org/our-networks/
vi University of Tokyo. (n.d.). SDGs projects. https://www.u-tokyo.ac.jp/adm/uci/en/projects/sdgs/index.php
vii Skipper, M. (2024, June 20). Why does Springer Nature value the UN Sustainable Development Goals (SDGs) so highly? The Researcher’s Source. https://www.springernature.com/gp/researchers/the-source/blog/blogposts-communicating-research/springer-nature-commitment-to-un-sdgs/27093144
viii Altmetric. (n.d.). Altmetric. https://www.altmetric.com/
ix United Nations. (2016). Science for sustainable development: Policy brief by the Scientific Advisory Board of the UN Secretary-General. UNESCO. https://unesdoc.unesco.org/ark:/48223/pf0000246105