Global
Research
Pulse:
India


Foreword
Ritu Dhand, Chief Scientific Officer, Springer Nature
I am pleased to introduce the latest report in our Global Research Pulse series, designed to equip our editors with timely, data-led insights to inform journal strategy and strengthen global engagement.
Our first Pulse report examined China’s research landscape. In this report, we turn our attention to India, the world’s fifth-largest economy and its most populous country since 2023.i There are 259 researchers in R&D for every million people in India.ii The country is the world’s largest outsourcer of computer programmers, produces 60% of the world’s vaccines, and became the fourth nation to make a soft landing on the Moon in 2023.iii, iv, v
At Springer Nature Indian research is the second largest source of submissions to our journals and the third-highest contributor to research globally. It is also now the third-highest contributor to the top 10% highly cited articles and ranks among the top three nations for high-impact research in applied, physical, and life sciences.vi And its growth in top-tier journal output (especially as captured within Nature Index) is outpacing that of China.vii
These signals point to a maturing and increasingly influential research environment in India. But beyond the numbers, our report also explores India’s institutional landscape, highlighting where investment, strategy, and collaboration point to future influence. We also identify resources to help editors to identify research excellence.
For Springer Nature editors, these reports provide a strategic resource to ensure that our publishing reflects the changing research landscape we work in. Twenty years ago, most of our research publishing came from Western countries. Today, research is increasingly global, with India set to increase its share. As publishers and editors, we have a responsibility to recognise global research excellence and act on this knowledge.


Ritu Dhand
Chief Scientific Officer
Springer Nature
1. India’s growth in
research quality


India’s research output has increased almost six-fold over the last decade and a half, rising from 34,000 articles in 2010 to 195,000 in 2024. This makes India the second-fastest-growing nation by total article count.
India now ranks ahead of several established G20 leaders by share of journal articles indexed in the Web of Science.
Importantly, this growth is not just about volume. In 2024, over 72% of India’s publications were in journals indexed in the Web of Science (WoS), a clear marker of international discoverability and minimum quality standards.viii With 5% market share of all indexed research publications, India now ranks ahead of several established G20 leaders, including the UK and Germany, underscoring its importance as a globally relevant research producer (Fig. 1).
Figure 1: Research output (2024) by country, Web of Science indexed and non-indexed, with five-year Compound Annual Growth Rate (CAGR).

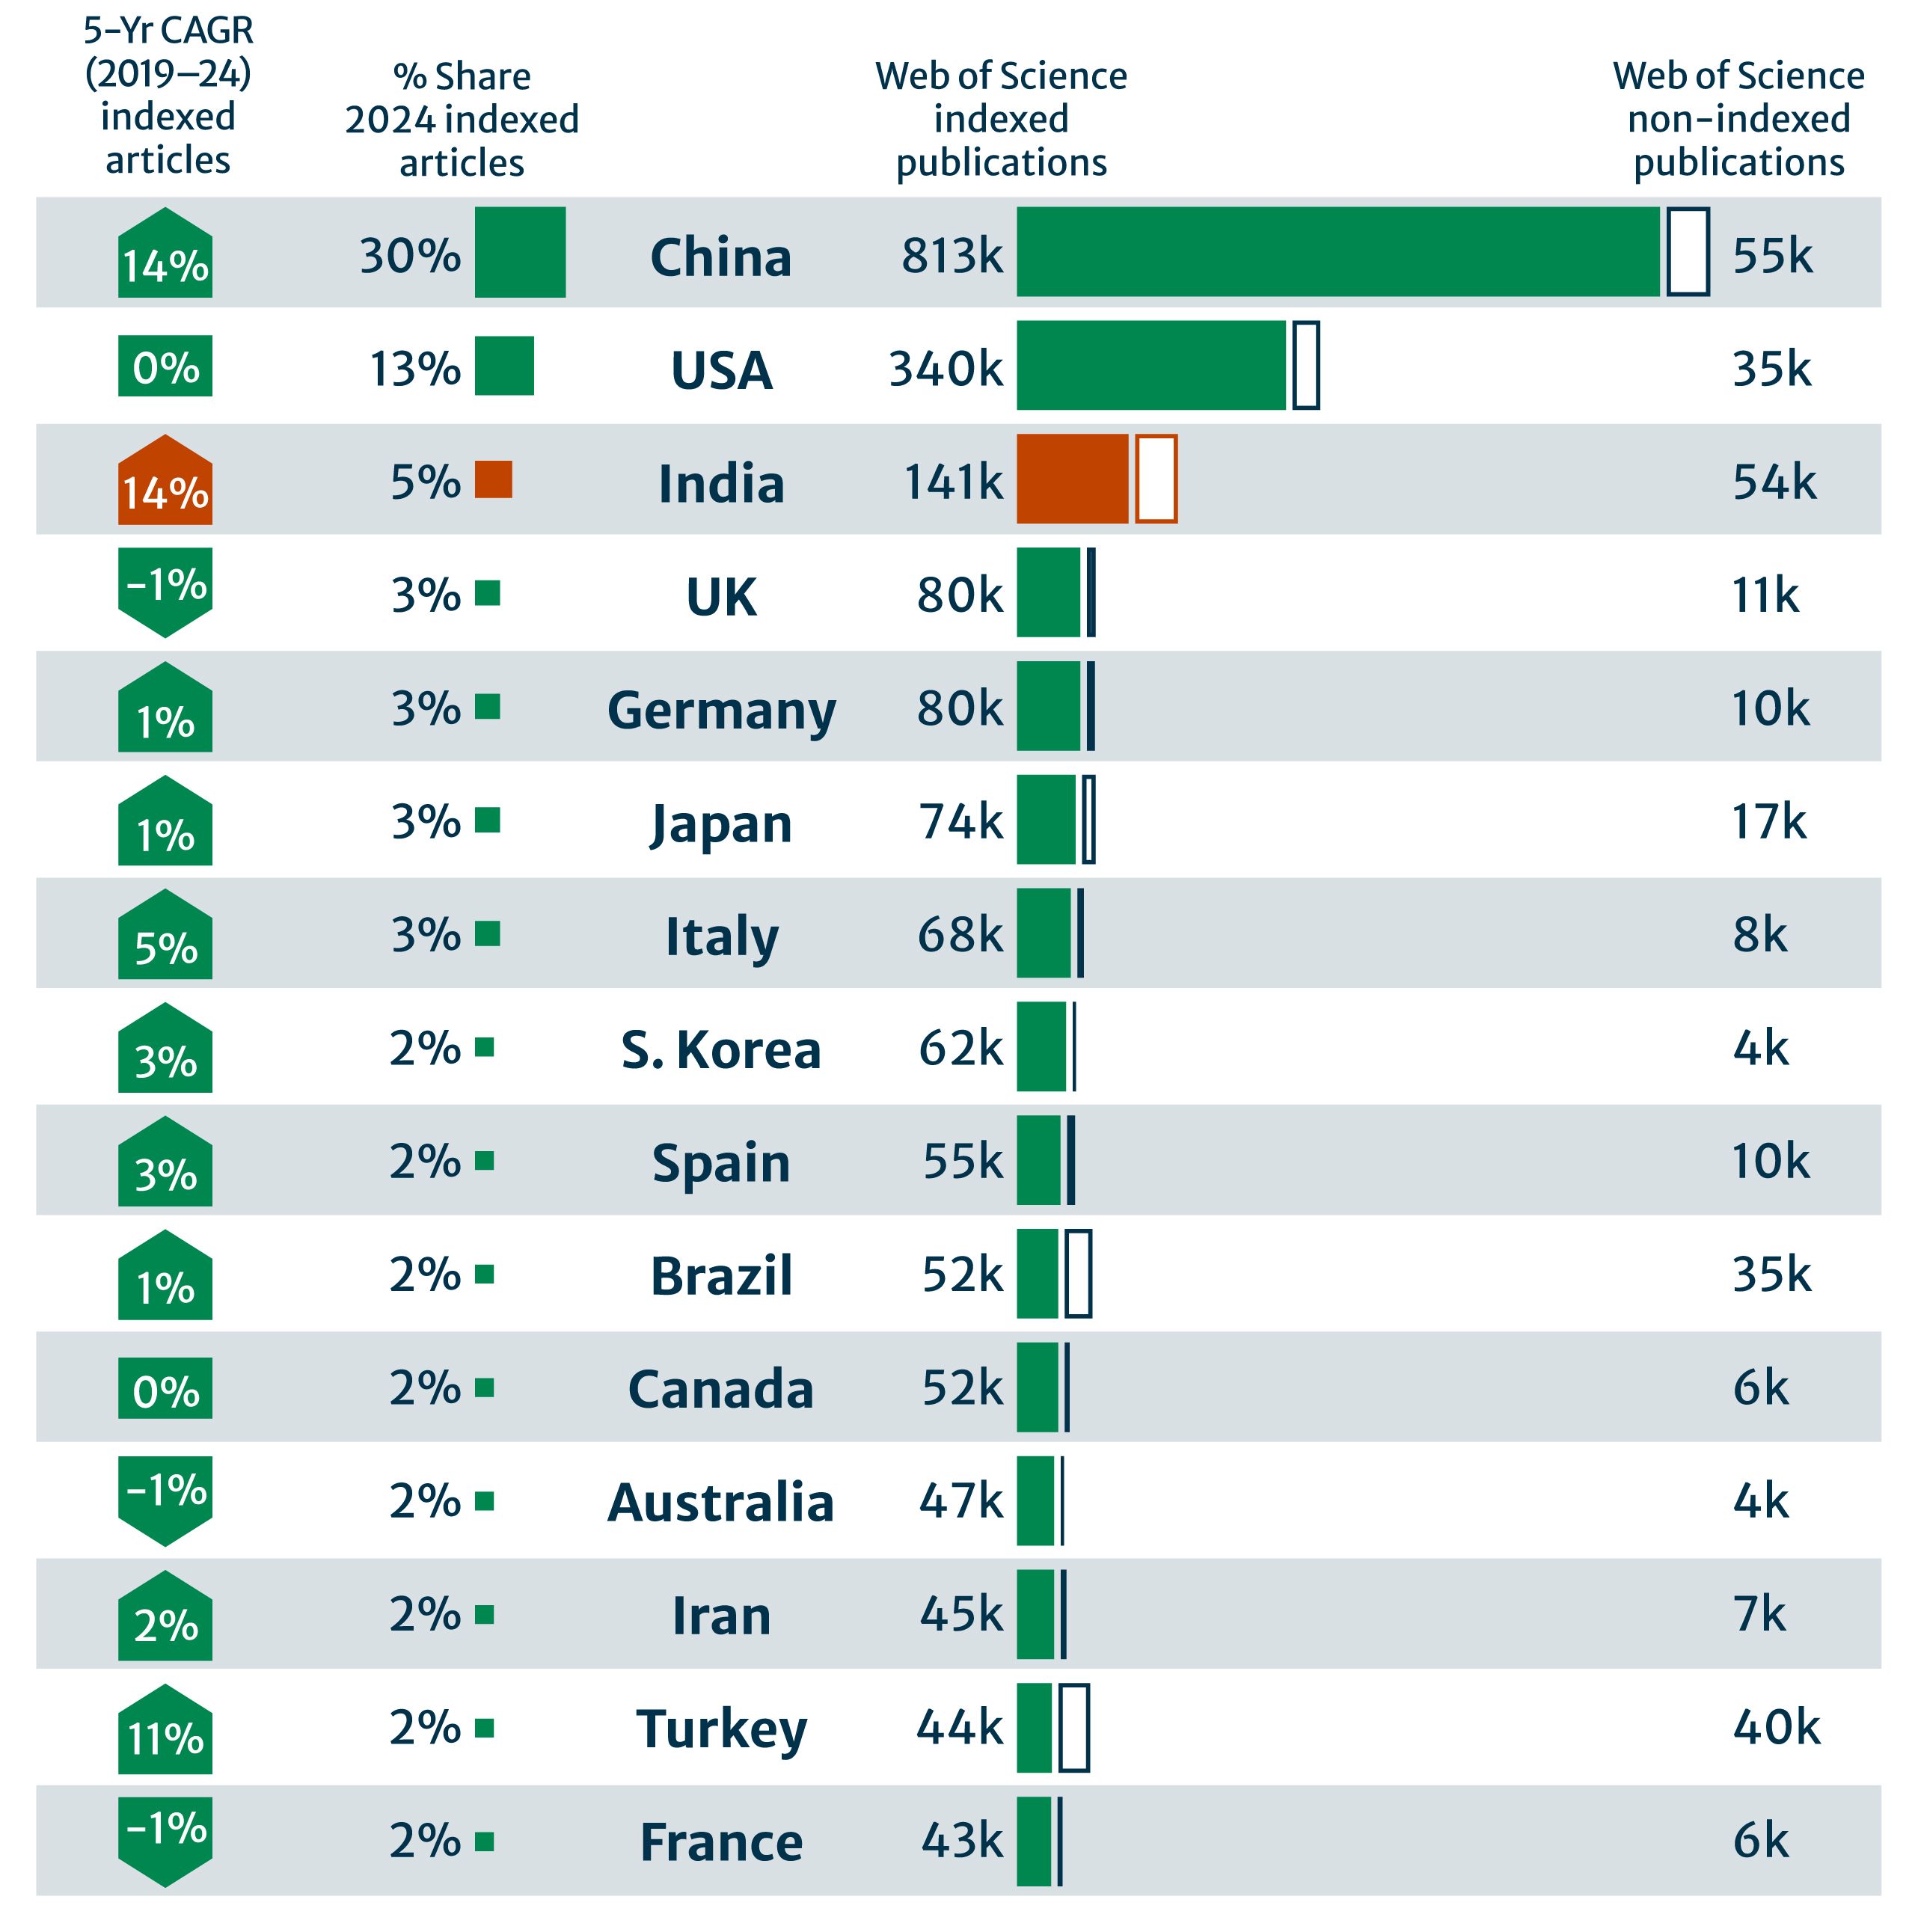
Table 1: Research output (2024) by country, Web of Science indexed and non-indexed, with five-year Compound Annual Growth Rate (CAGR).
|
Country |
Indexed Web of Science |
Not Indexed |
5-Yr CAGR (2019–24) |
% Share 2024 |
|---|---|---|---|---|
|
China |
813K |
55K |
14% |
30% |
|
USA |
340K |
35K |
0% |
13% |
|
India |
141K |
54K |
14% |
5% |
|
UK |
80K |
11K |
-1% |
3% |
|
Germany |
80K |
10K |
1% |
3% |
|
Japan |
74K |
17K |
1% |
3% |
|
Italy |
68K |
8K |
5% |
3% |
|
S. Korea |
62K |
4K |
3% |
2% |
|
Spain |
55K |
10K |
3% |
2% |
|
Brazil |
52K |
35K |
1% |
2% |
|
Canada |
52K |
6K |
0% |
2% |
|
Australia |
47K |
4K |
-1% |
2% |
|
Iran |
45K |
7K |
2% |
2% |
|
Turkey |
44K |
40K |
11% |
2% |
|
France |
43K |
6K |
-1% |
2% |
India’s research impact is steadily increasing and closing the gap on other G20 nations.
India’s research impact is steadily increasing and closing the gap on other G20 nations. For the period 2015–2024, India’s Category Normalized Citation Impact (CNCI) for all paper averages was 0.9, up from 0.7 a decade earlier (where a CNCI value greater than 1.0 indicates that a paper is cited more frequently than the world average). On internationally authored papers, India’s CNCI is significantly above world average and reached 1.4x (Clarivate G20 research and innovation scorecard 2025).ix For comparison, the G20 average of 1.0 for the same period shows India’s significant progress.
Figure 2: Comparison of India and G20 nations’ CNCI 2015 – 2024.

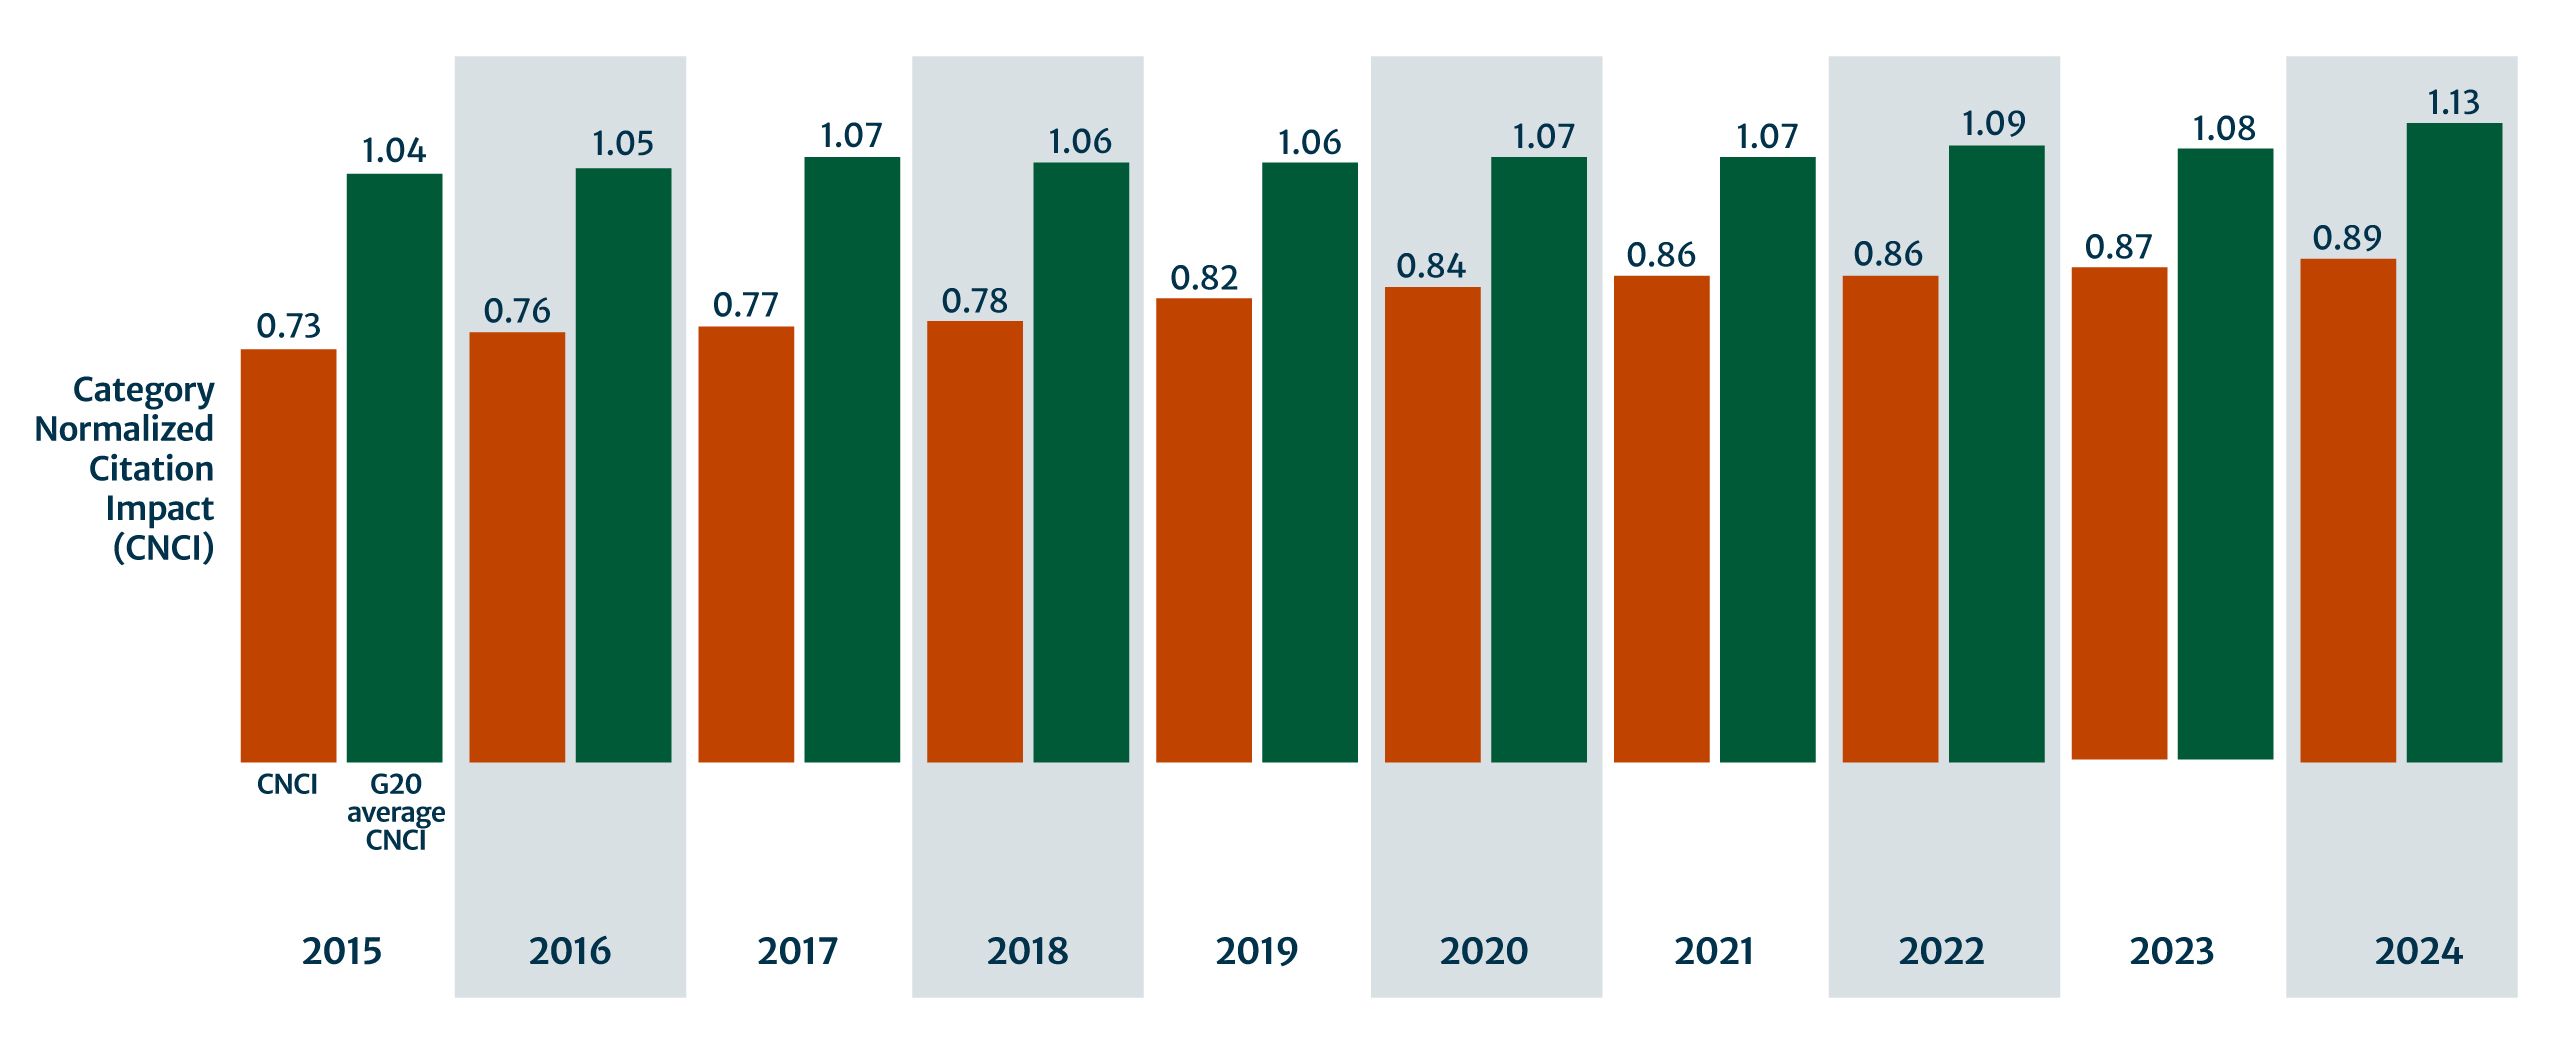
Figure 3: The distribution of Indian research by increasing CNCl impact bands versus the G20 average for the period 2015-2024 also shows the significant progress India has made in increasing the volume of above world average research.

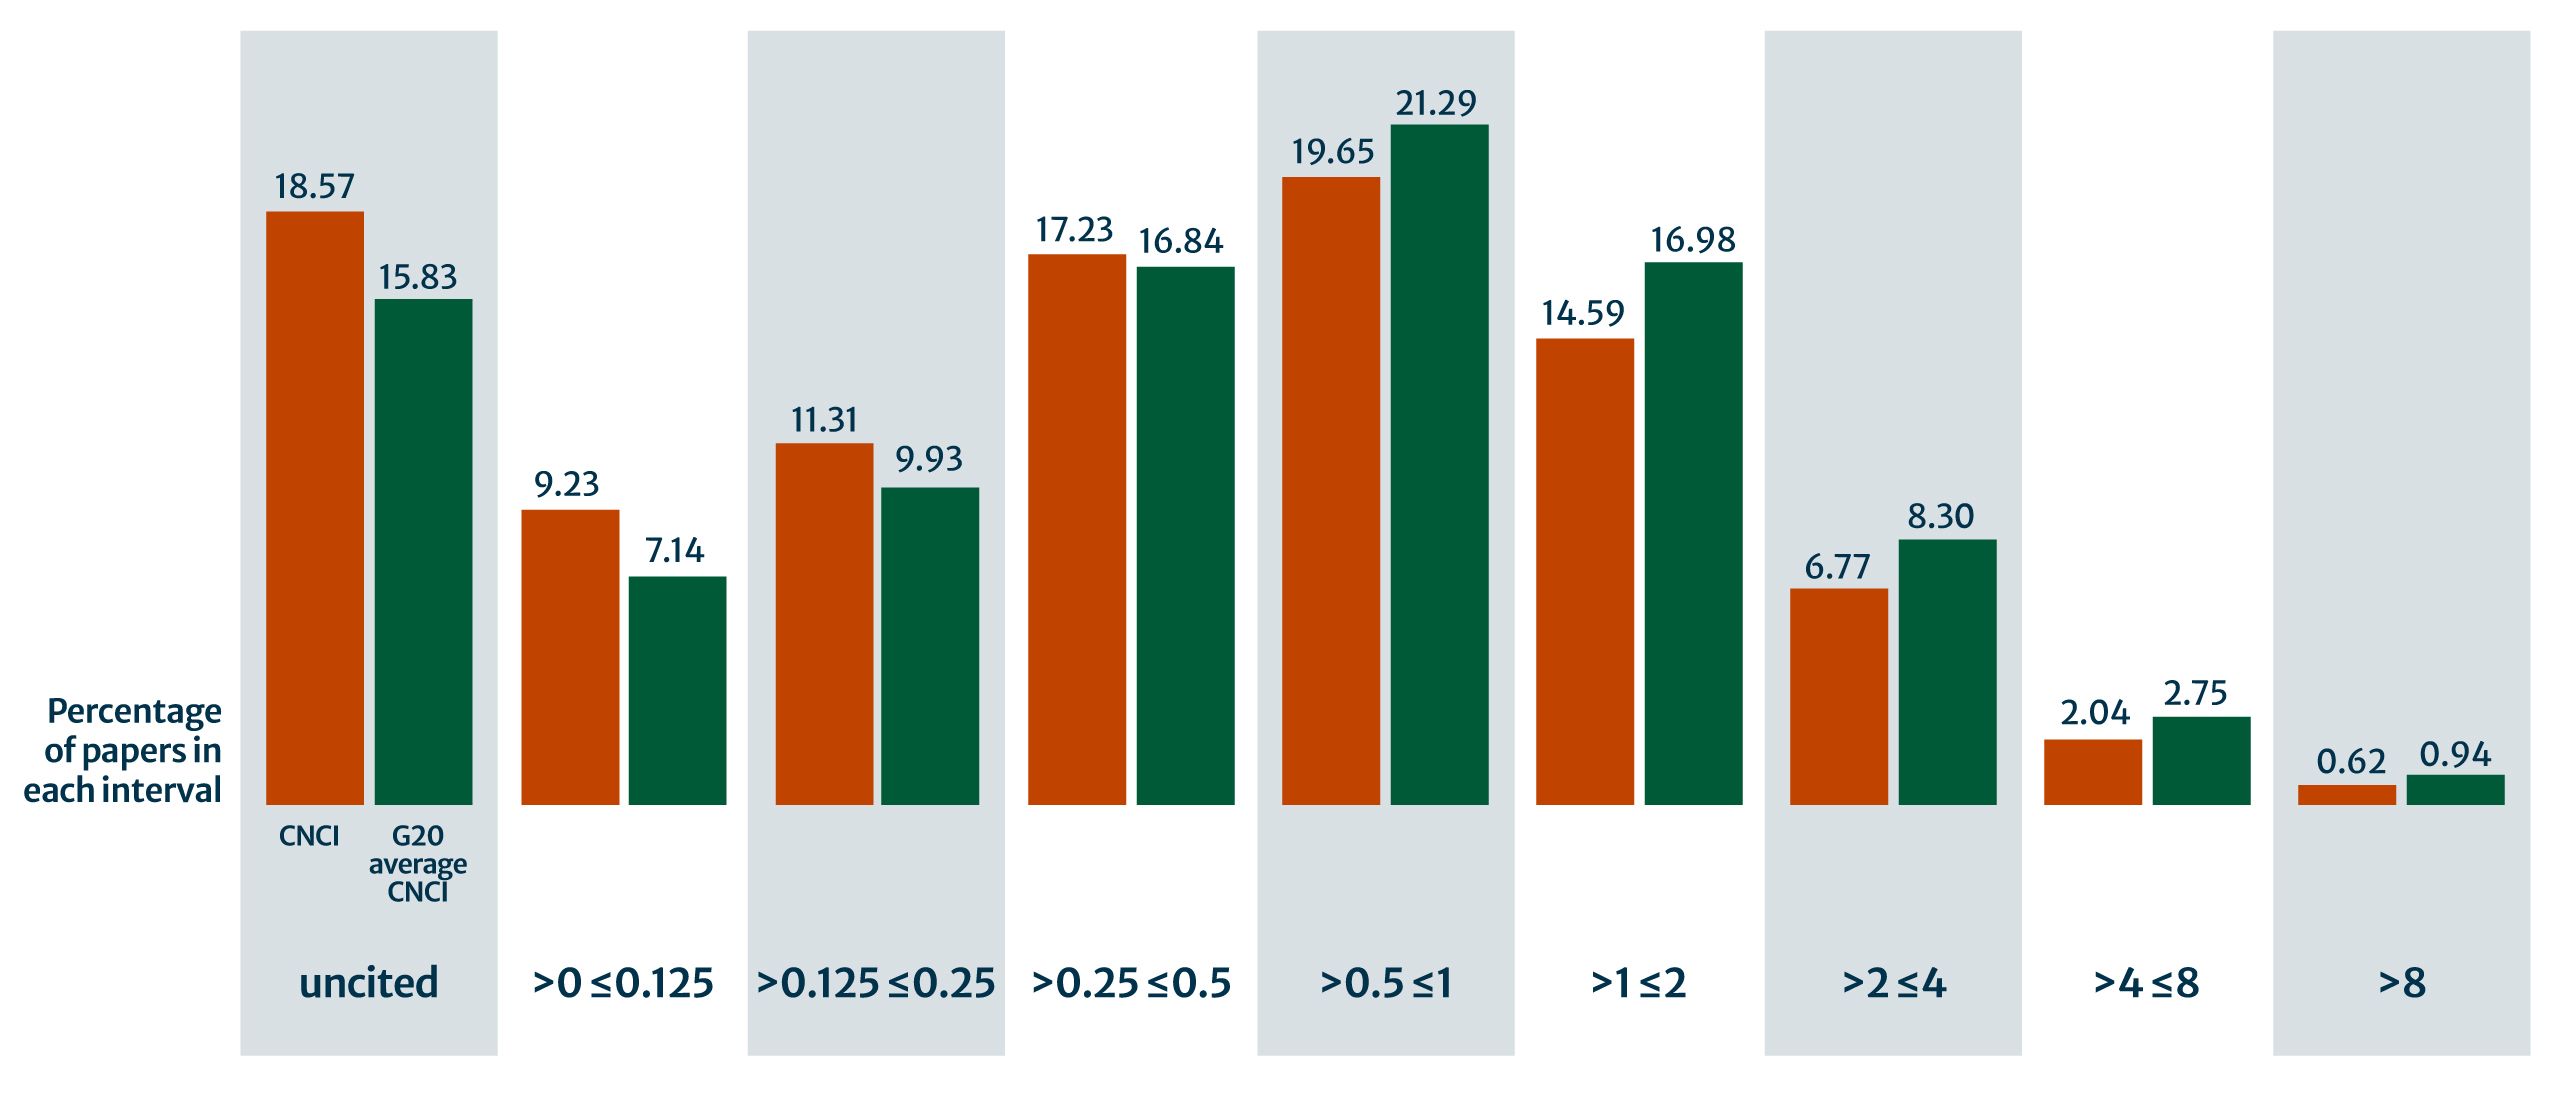
Table 2: Comparison of India and G20 nations’ CNCI 2015 – 2024.
|
Category Normalized Citation Impact (CNCI) |
2015 |
2016 |
2017 |
2018 |
2019 |
2020 |
2021 |
2022 |
2023 |
2024 |
|---|---|---|---|---|---|---|---|---|---|---|
|
CNCI |
0.73 |
0.76 |
0.77 |
0.78 |
0.82 |
0.84 |
0.86 |
0.86 |
0.87 |
0.89 |
|
G20 average CNCI |
1.04 |
1.05 |
1.07 |
1.06 |
1.06 |
1.07 |
1.07 |
1.09 |
1.08 |
1.13 |
Table 3: Distribution of Indian research by CNCI band vs G20 average for the period 2015 – 2024. (A CNCI value greater than 1.0 indicates that a paper is cited more frequently than the world average.)
|
Percentage of papers in each interval |
uncited |
>0 ≤0.125 |
>0.125 ≤0.25 |
>0.25 ≤0.5 |
>0.5 ≤1 |
>1 ≤2 |
>2 ≤4 |
>4 ≤8 |
>8 |
|---|---|---|---|---|---|---|---|---|---|
|
CNCI |
18.57% |
9.23% |
11.31% |
17.23% |
19.65% |
14.59% |
6.77% |
2.04% |
0.62% |
|
G20 average CNCI |
15.83% |
7.14% |
9.93% |
16.84% |
21.29% |
16.98% |
8.30% |
2.75% |
0.94% |
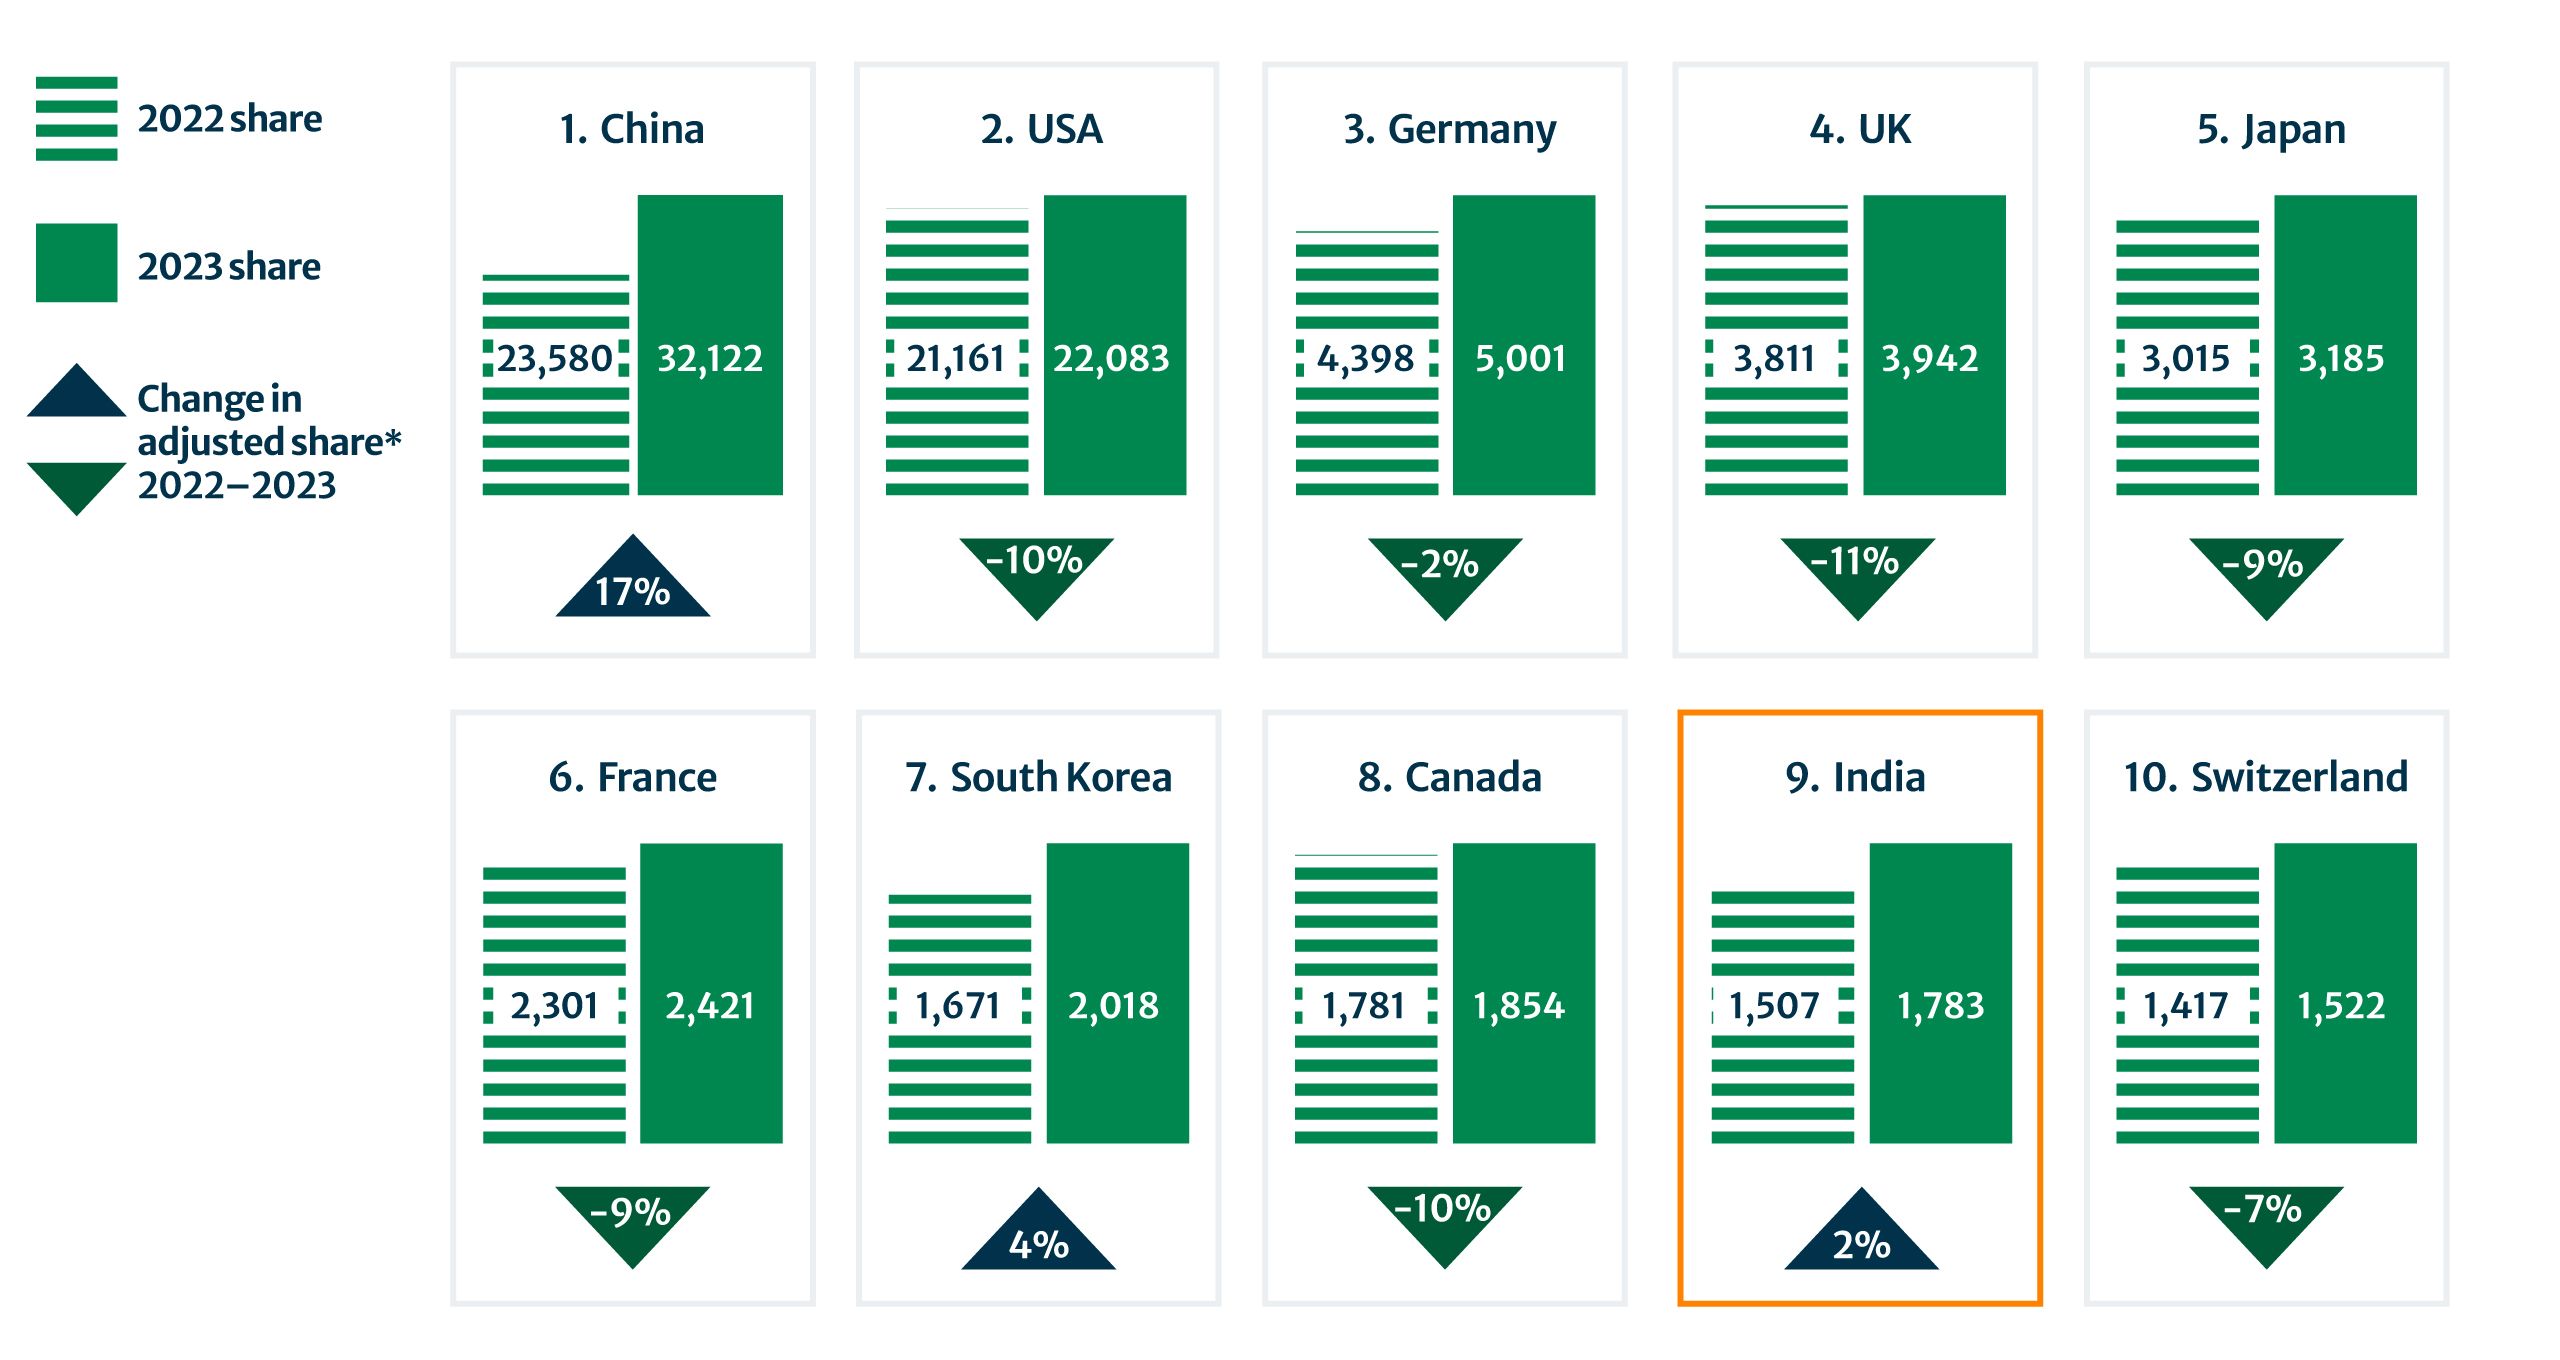
India is ranked 9th globally in the 2025 Nature Index, surpassing several traditionally strong research nations such as the United Kingdom, the United States, and Germany.
India’s rising research quality is also reflected in its growing contributions to the Nature Index, which tracks research published in the top natural and health sciences journals, based on reputation and chosen by an independent panel of researchers. In the 2024 Nature Index Research Leaders tables, India ranked 9th globally (Fig. 4), with a 14.5% increase in adjusted share from 2022 to 2023.x
While the volume of articles included in the Index is still modest at just 1,506 in 2024, India’s growth continues to exceed other established research nations such as the UK, USA, and Germany, all of which experienced year-on-year declines in adjusted share. This not only signals burgeoning competitiveness from India but also emphasises that there is a broader shift in research influence from leading economies to emerging nations.
Figure 4: Nature Index 2025 Research Leaders: share of coverage for the top ten countries

*read an explanation of the adjusted share metric.
Note: Nature Index recognises that many other factors must be taken into account when considering research quality and institutional performance; Nature Index metrics alone should not be used to assess institutions or individuals. Nature Index data and methods are transparent and available under a Creative Commons license at natureindex.com
Table 4: Nature Index 2025 Research Leaders: share of coverage for the top ten countries
|
Country/territory |
Share 2022 |
Share 2023 |
Change in Adjusted Share 2022-2023 |
|---|---|---|---|
|
1. China |
23580.3 |
32121.81 |
17% |
|
2. USA |
21160.53 |
22082.59 |
-10% |
|
3. Germany |
4397.78 |
5000.9 |
-2% |
|
4. UK |
3810.874 |
3942.012 |
-11% |
|
5. Japan |
3015.067 |
3185.388 |
-9% |
|
6. France |
2301.436 |
2421.392 |
-9% |
|
7. South Korea |
1670.918 |
2017.954 |
4% |
|
8. Canada |
1780.901 |
1854.494 |
-10% |
|
9. India |
1506.638 |
1783.337 |
2% |
|
10. Switzerland |
1417.242 |
1522.496 |
-7% |
In 2024 67% of Indian research was published in the top 50% of all journals.
The distribution of research in Clarivate’s Journal Citation Reports quartile rankings also shows India’s strong representation in internationally respected journals. In the 2024 JCR quartiles, 67% of Indian research was published in the top two quartiles, which represent the top 50% of all journals across all subjects (Fig. 5).
Figure 5: Percentage of research articles by country and quartile, 2024 Journal Citation Reports

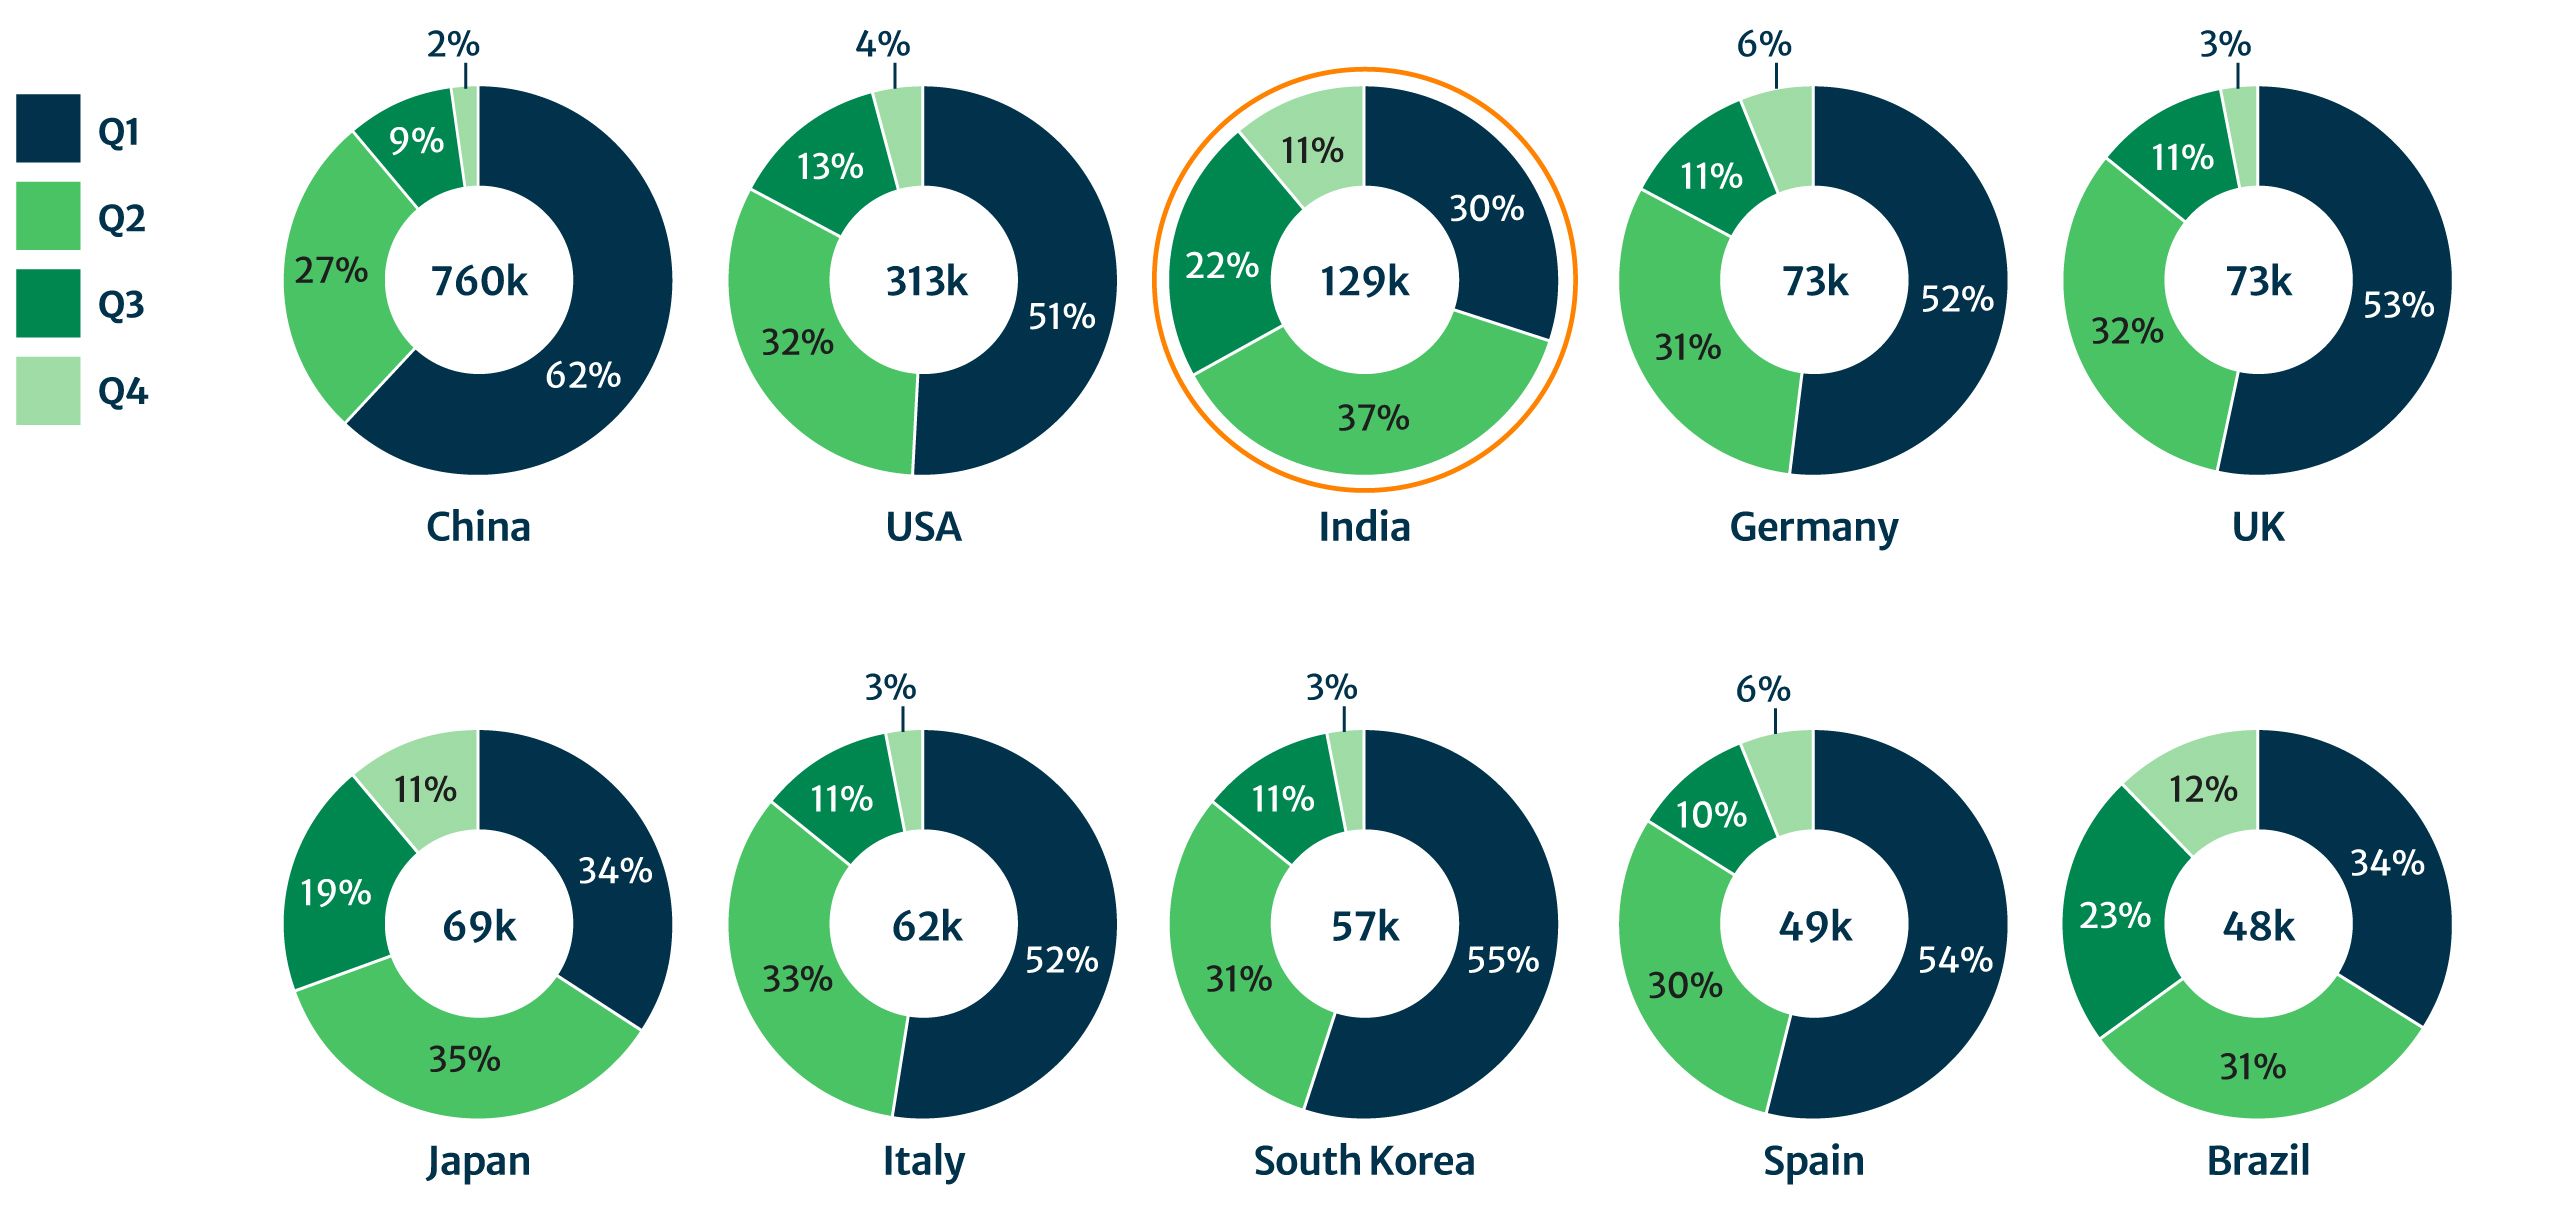
Table 5: Percentage of research articles by country and quartile, 2024 Journal Citation Reports
|
Country/territory |
Q1 |
Q2 |
Q3 |
Q4 |
Overall |
|---|---|---|---|---|---|
|
China |
62% |
27% |
9% |
2% |
760K |
|
USA |
51% |
32% |
13% |
4% |
313K |
|
India |
30% |
37% |
22% |
11% |
129K |
|
Germany |
52% |
31% |
11% |
6% |
73K |
|
UK |
53% |
32% |
11% |
3% |
73K |
|
Japan |
34% |
35% |
19% |
11% |
69K |
|
Italy |
52% |
33% |
11% |
3% |
62K |
|
South Korea |
55% |
31% |
11% |
3% |
57K |
|
Spain |
54% |
30% |
10% |
6% |
49K |
|
Brazil |
34% |
31% |
23% |
12% |
48K |
India now ranks 3rd globally behind China and the USA, with 19,000 articles in the top 10% of most cited papers.
India also excels at the top end of the impact spectrum, publishing a significant volume of the most cited papers from 2023. Dimensions shows over 386,000 articles in the top 10% of cited papers within their Field of Research (Fig. 6). India now ranks 3rd globally behind China and the USA, with 19,000 articles (comprising 11% of its publications) among the top 10% of most cited papers. There is, therefore, a growing volume of highly influential research coming from the region. Representing 5% of the total top 10% globally, India is on par or higher than many established research nations.
Figure 6: Volume of papers in the top 10% cited papers – share by country
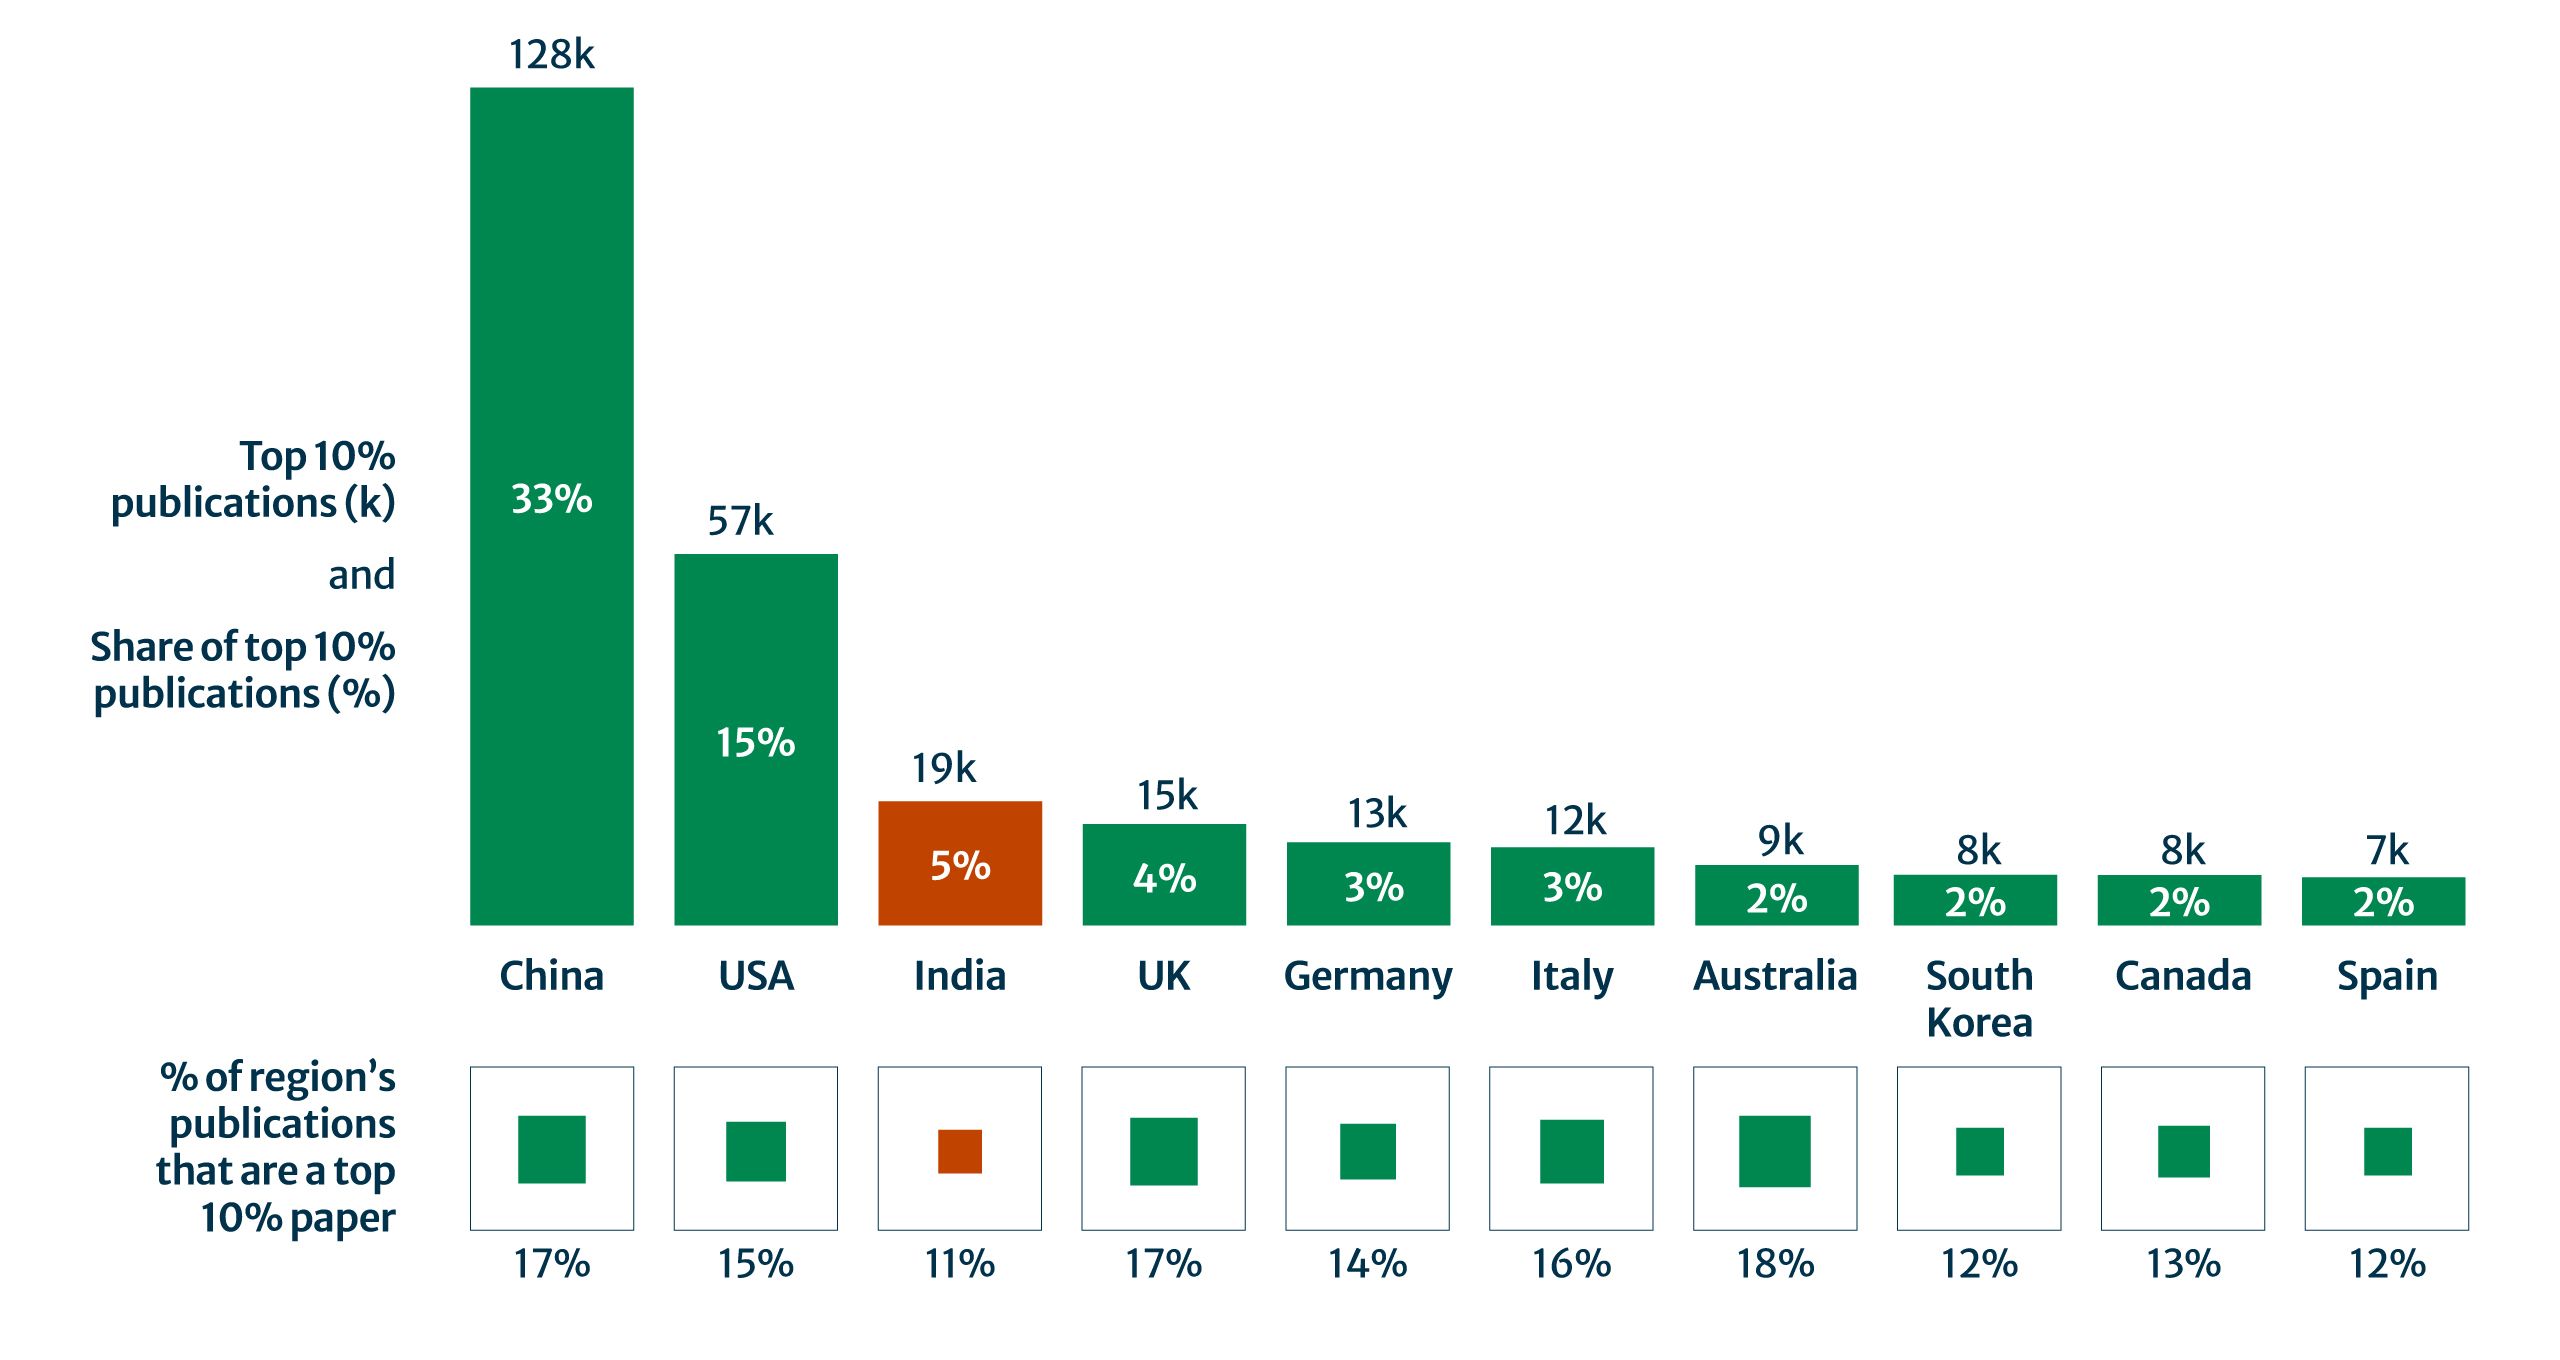
Table 6: Volume of papers in the top 10% cited papers – share by country
|
Country/territory |
Top 10% publications |
% share of top 10% publications |
% of region’s publications a top 10% paper |
|---|---|---|---|
|
China |
128K |
33% |
17% |
|
US |
57K |
15% |
15% |
|
India |
19K |
5% |
11% |
|
UK |
15K |
4% |
17% |
|
Germany |
13K |
3% |
14% |
|
Italy |
12K |
3% |
16% |
|
Australia |
9K |
2% |
18% |
|
S. Korea |
8K |
2% |
12% |
|
Canada |
8K |
2% |
13% |
|
Spain |
7K |
2% |
12% |
India ranks in the top three countries globally for applied sciences, life sciences, physical sciences, and top 10 countries for medicine and humanities and social sciences (HSS).
A closer look at field-specific performance shows that India ranks in the top three countries globally for applied sciences, life sciences, physical sciences, and top 10 countries for medicine and humanities and social sciences (HSS) (Fig. 7).
Figure 7: Contributions to the top 10% of most cited papers published in 2023 by discipline – share by country

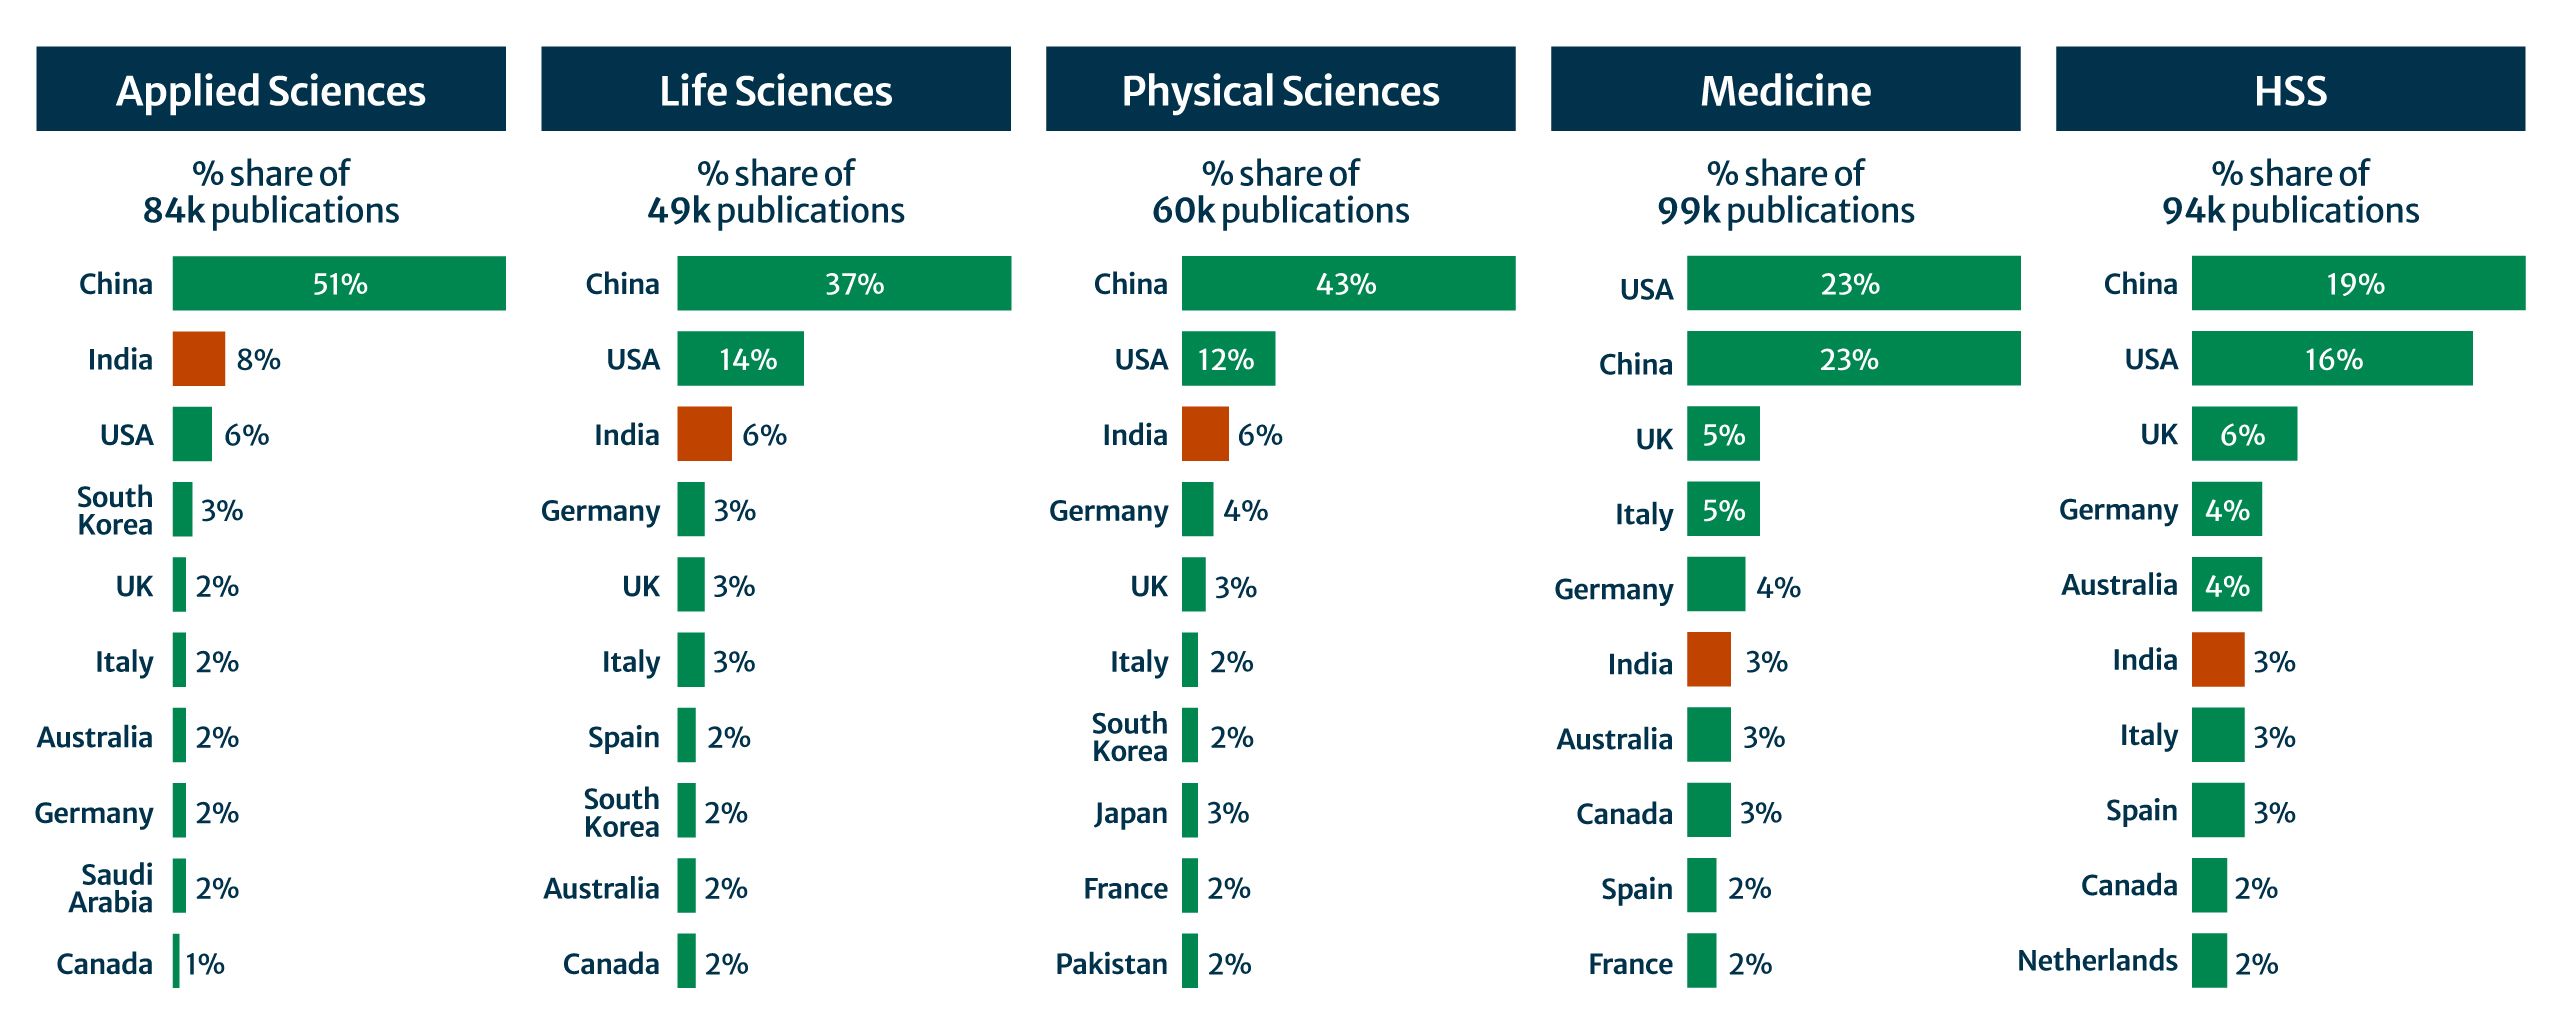
Table 7: Contributions to the top 10% of most cited papers published in 2023 by discipline – share by country
|
Country/territory |
Proportion of Top 10% most cited papers (84,000 articles) from each country within Applied Sciences |
|---|---|
|
China |
51% |
|
India |
8% |
|
US |
6% |
|
S. Korea |
3% |
|
UK |
2% |
|
Italy |
2% |
|
Australia |
2% |
|
Germany |
2% |
|
Saudi Arabia |
2% |
|
Canada |
1% |
|
Country/territory |
Proportion of Top 10% most cited papers (49,000 articles) from each country within Life Sciences |
|---|---|
|
China |
37% |
|
US |
14% |
|
India |
6% |
|
Germany |
3% |
|
UK |
3% |
|
Italy |
3% |
|
Spain |
2% |
|
S. Korea |
2% |
|
Australia |
2% |
|
Canada |
2% |
|
Country/territory |
Proportion of Top 10% most cited papers (60,000 articles) from each country within Physical Sciences |
|---|---|
|
China |
43% |
|
US |
12% |
|
India |
6% |
|
Germany |
4% |
|
UK |
3% |
|
Italy |
2% |
|
S.Korea |
2% |
|
Japan |
2% |
|
France |
2% |
|
Pakistan |
2% |
|
Country/territory |
Proportion of Top 10% most cited papers (99,000 articles) from each country within Medicine |
|---|---|
|
US |
23% |
|
China |
23% |
|
UK |
5% |
|
Italy |
5% |
|
Germany |
4% |
|
India |
3% |
|
Australia |
3% |
|
Canada |
3% |
|
Spain |
2% |
|
France |
2% |
|
Country/territory |
Proportion of Top 10% most cited papers (94,000 articles) from each country within HSS |
|---|---|
|
China |
19% |
|
US |
16% |
|
UK |
6% |
|
Germany |
4% |
|
Australia |
4% |
|
India |
3% |
|
Italy |
3% |
|
Spain |
3% |
|
Canada |
2% |
|
Netherlands |
2% |
Nature Index also notes India’s rising prominence in chemistry, with the subject comprising almost 60% of its total Nature Index output.xi
India’s contributions to the UN Sustainable Development Goals (SDGs) reflect a research agenda increasingly aligned to global priorities.
India’s contributions to the UN Sustainable Development Goals (SDGs) reflect a research agenda increasingly aligned to global priorities (Fig. 8). India is producing a higher share of SDG-aligned research than G20 averages in SDG 2 (Zero Hunger), SDG 3 (Good Health and Well-being), SDG 6 (Clean Water and Sanitation), SDG 7 (Affordable and Clean Energy), SDG 11 (Sustainable Cities and Communities), and SDG 12 (Responsible Consumption and Production).
Crucially, this SDG research is also delivering citation impact, with above world average (CNCI~1) citation impact in industry, economic growth, clean water and consumption.
Figure 8: Share of output and citation impact of Indian research by SDG, 2015 – 2024
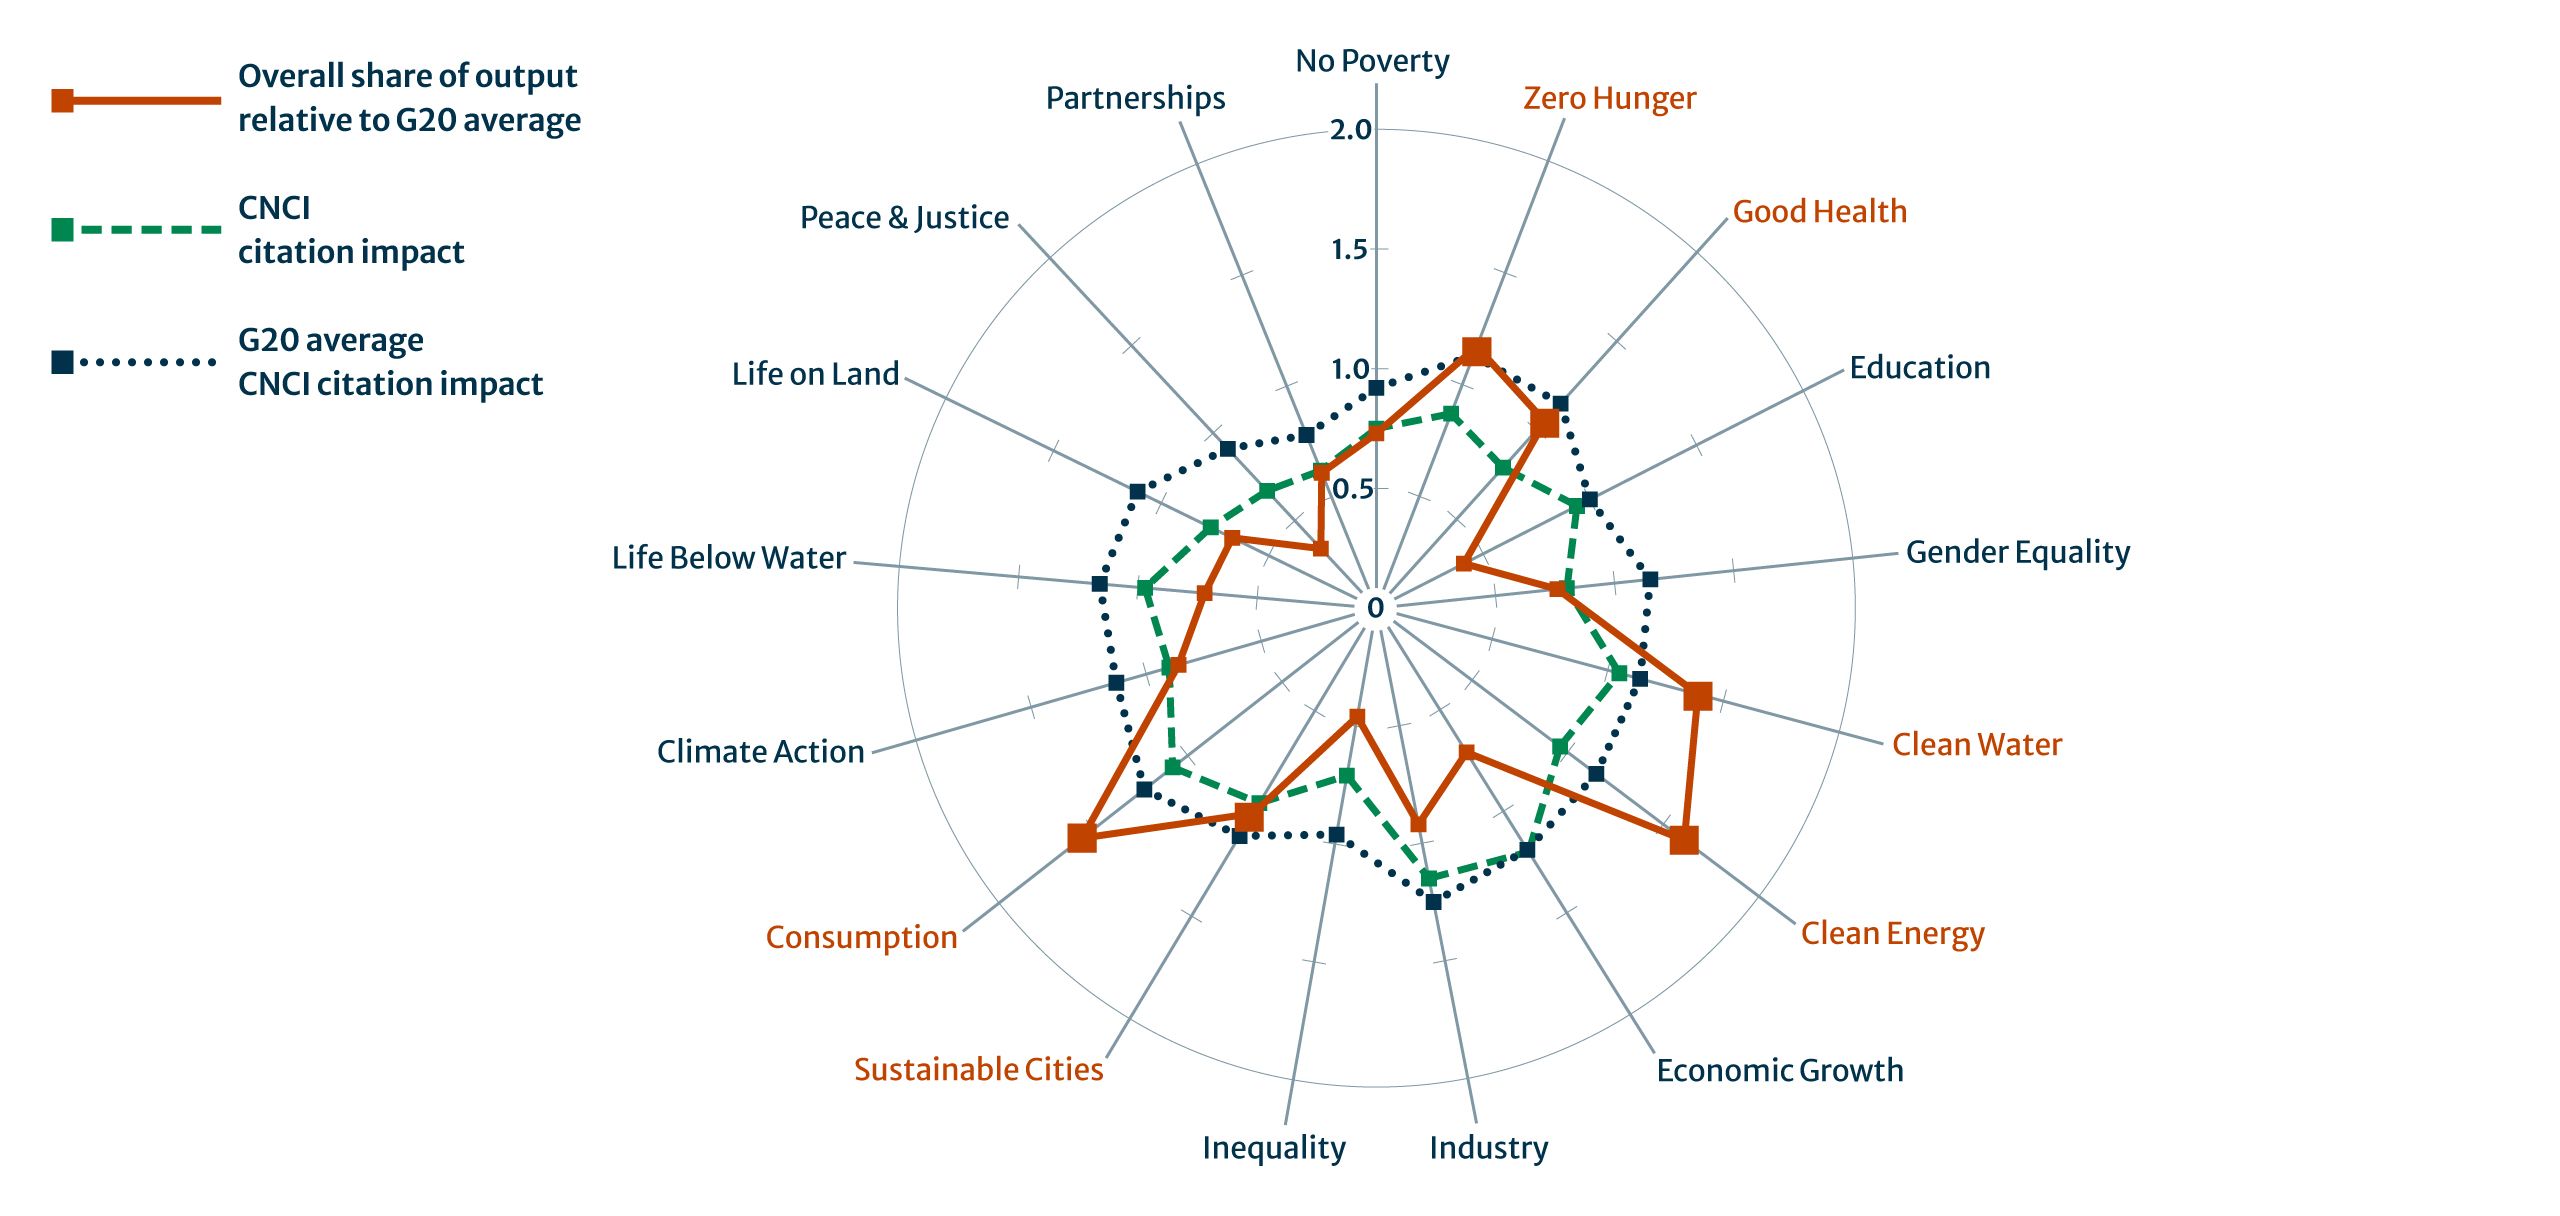
Table 8: Share of output and citation impact of Indian research by SDG, 2015–2024
|
SDG |
Overall share of output relative to G20 average |
CNCI citation impact |
G20 average CNCI citation impact |
|---|---|---|---|
|
No Poverty |
0.73 |
0.75 |
0.92 |
|
Zero Hunger |
1.17 |
0.87 |
1.13 |
|
Good Health |
1.05 |
0.79 |
1.15 |
|
Education |
0.41 |
0.94 |
1 |
|
Gender Equality |
0.76 |
0.8 |
1.15 |
|
Clean Water |
1.39 |
1.05 |
1.14 |
|
Clean Energy |
1.61 |
0.96 |
1.15 |
|
Economic Growth |
0.71 |
1.2 |
1.19 |
|
Industry |
0.92 |
1.15 |
1.25 |
|
Inequality |
0.46 |
0.71 |
0.96 |
|
Sustainable Cities |
1 |
0.95 |
1.11 |
|
Consumption |
1.56 |
1.08 |
1.23 |
|
Climate Action |
0.86 |
0.9 |
1.13 |
|
Life Below Water |
0.72 |
0.97 |
1.16 |
|
Life on Land |
0.67 |
0.77 |
1.11 |
|
Peace & Justice |
0.34 |
0.67 |
0.91 |
|
Partnerships |
0.61 |
0.62 |
0.78 |
2. India’s growing
status in research


How has India emerged as a global research player? In this section, we explore the strategic investments, institutional reforms, and international collaborations that are fuelling the country’s rise in high-quality research output.
2.1. R&D investment
Over the past three decades, India has steadily increased its R&D spending in absolute terms (Fig. 9). However, as a percentage of total GDP, R&D investment remains low at less than 1%, compared to over 2.5% of GDP in China.xii
Figure 9: India’s national R&D expenditure, 1996–2020

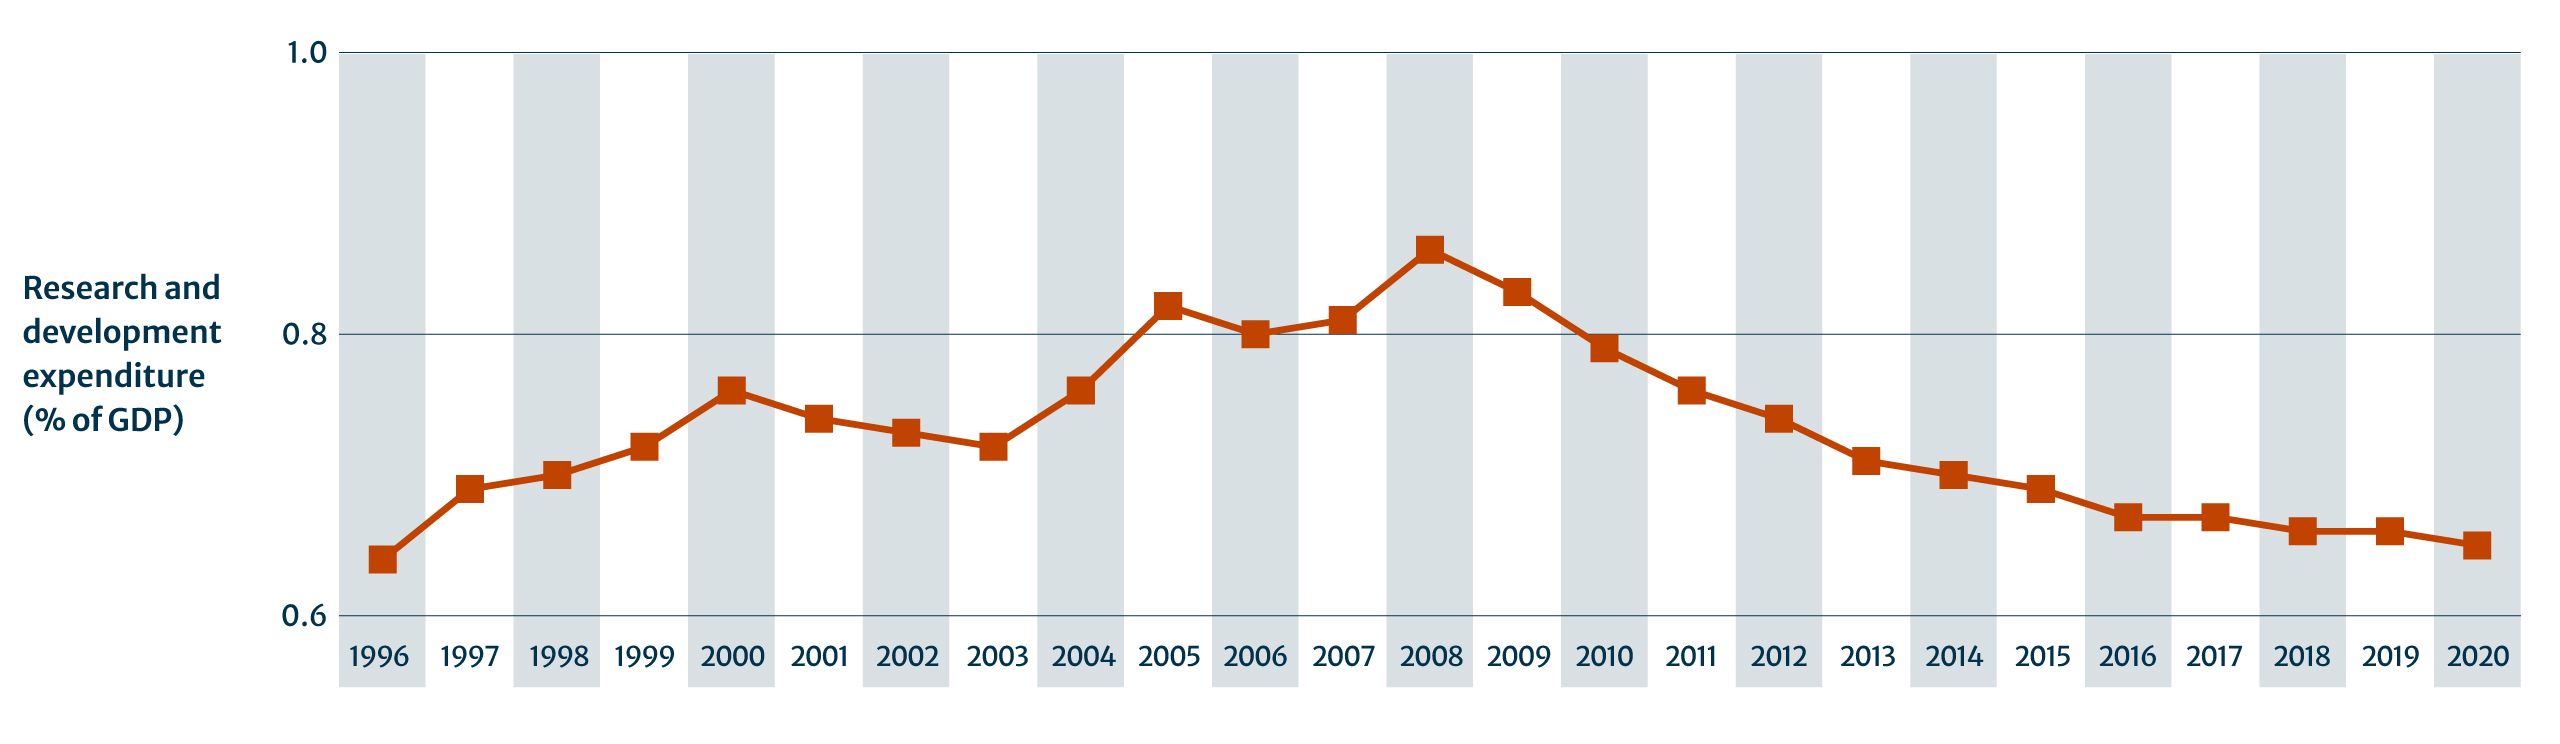
Table 9: India’s national R&D expenditure, 1996–2020.
|
Year |
1996 |
1997 |
1998 |
1999 |
2000 |
2001 |
2002 |
2003 |
2004 |
2005 |
2006 |
2007 |
2008 |
2009 |
2010 |
2011 |
2012 |
2013 |
2014 |
2015 |
2016 |
2017 |
2018 |
2019 |
2020 |
|---|---|---|---|---|---|---|---|---|---|---|---|---|---|---|---|---|---|---|---|---|---|---|---|---|---|
|
R&D expenditure |
0.64 |
0.69 |
0.7 |
0.72 |
0.76 |
0.74 |
0.73 |
0.72 |
0.76 |
0.82 |
0.8 |
0.81 |
0.86 |
0.83 |
0.79 |
0.76 |
0.74 |
0.71 |
0.7 |
0.69 |
0.67 |
0.67 |
0.66 |
0.66 |
0.65 |
What sets India apart is the structure of its funding. Approximately 50% of all R&D investment comes from the government, by far the highest among major research-producing nations. In contrast, private sector contributions dominate research funding elsewhere globally (Fig. 10).
Figure 10: Participation of government, business enterprise and higher education in gross domestic expenditure on research and development (GERD) by country, 2020

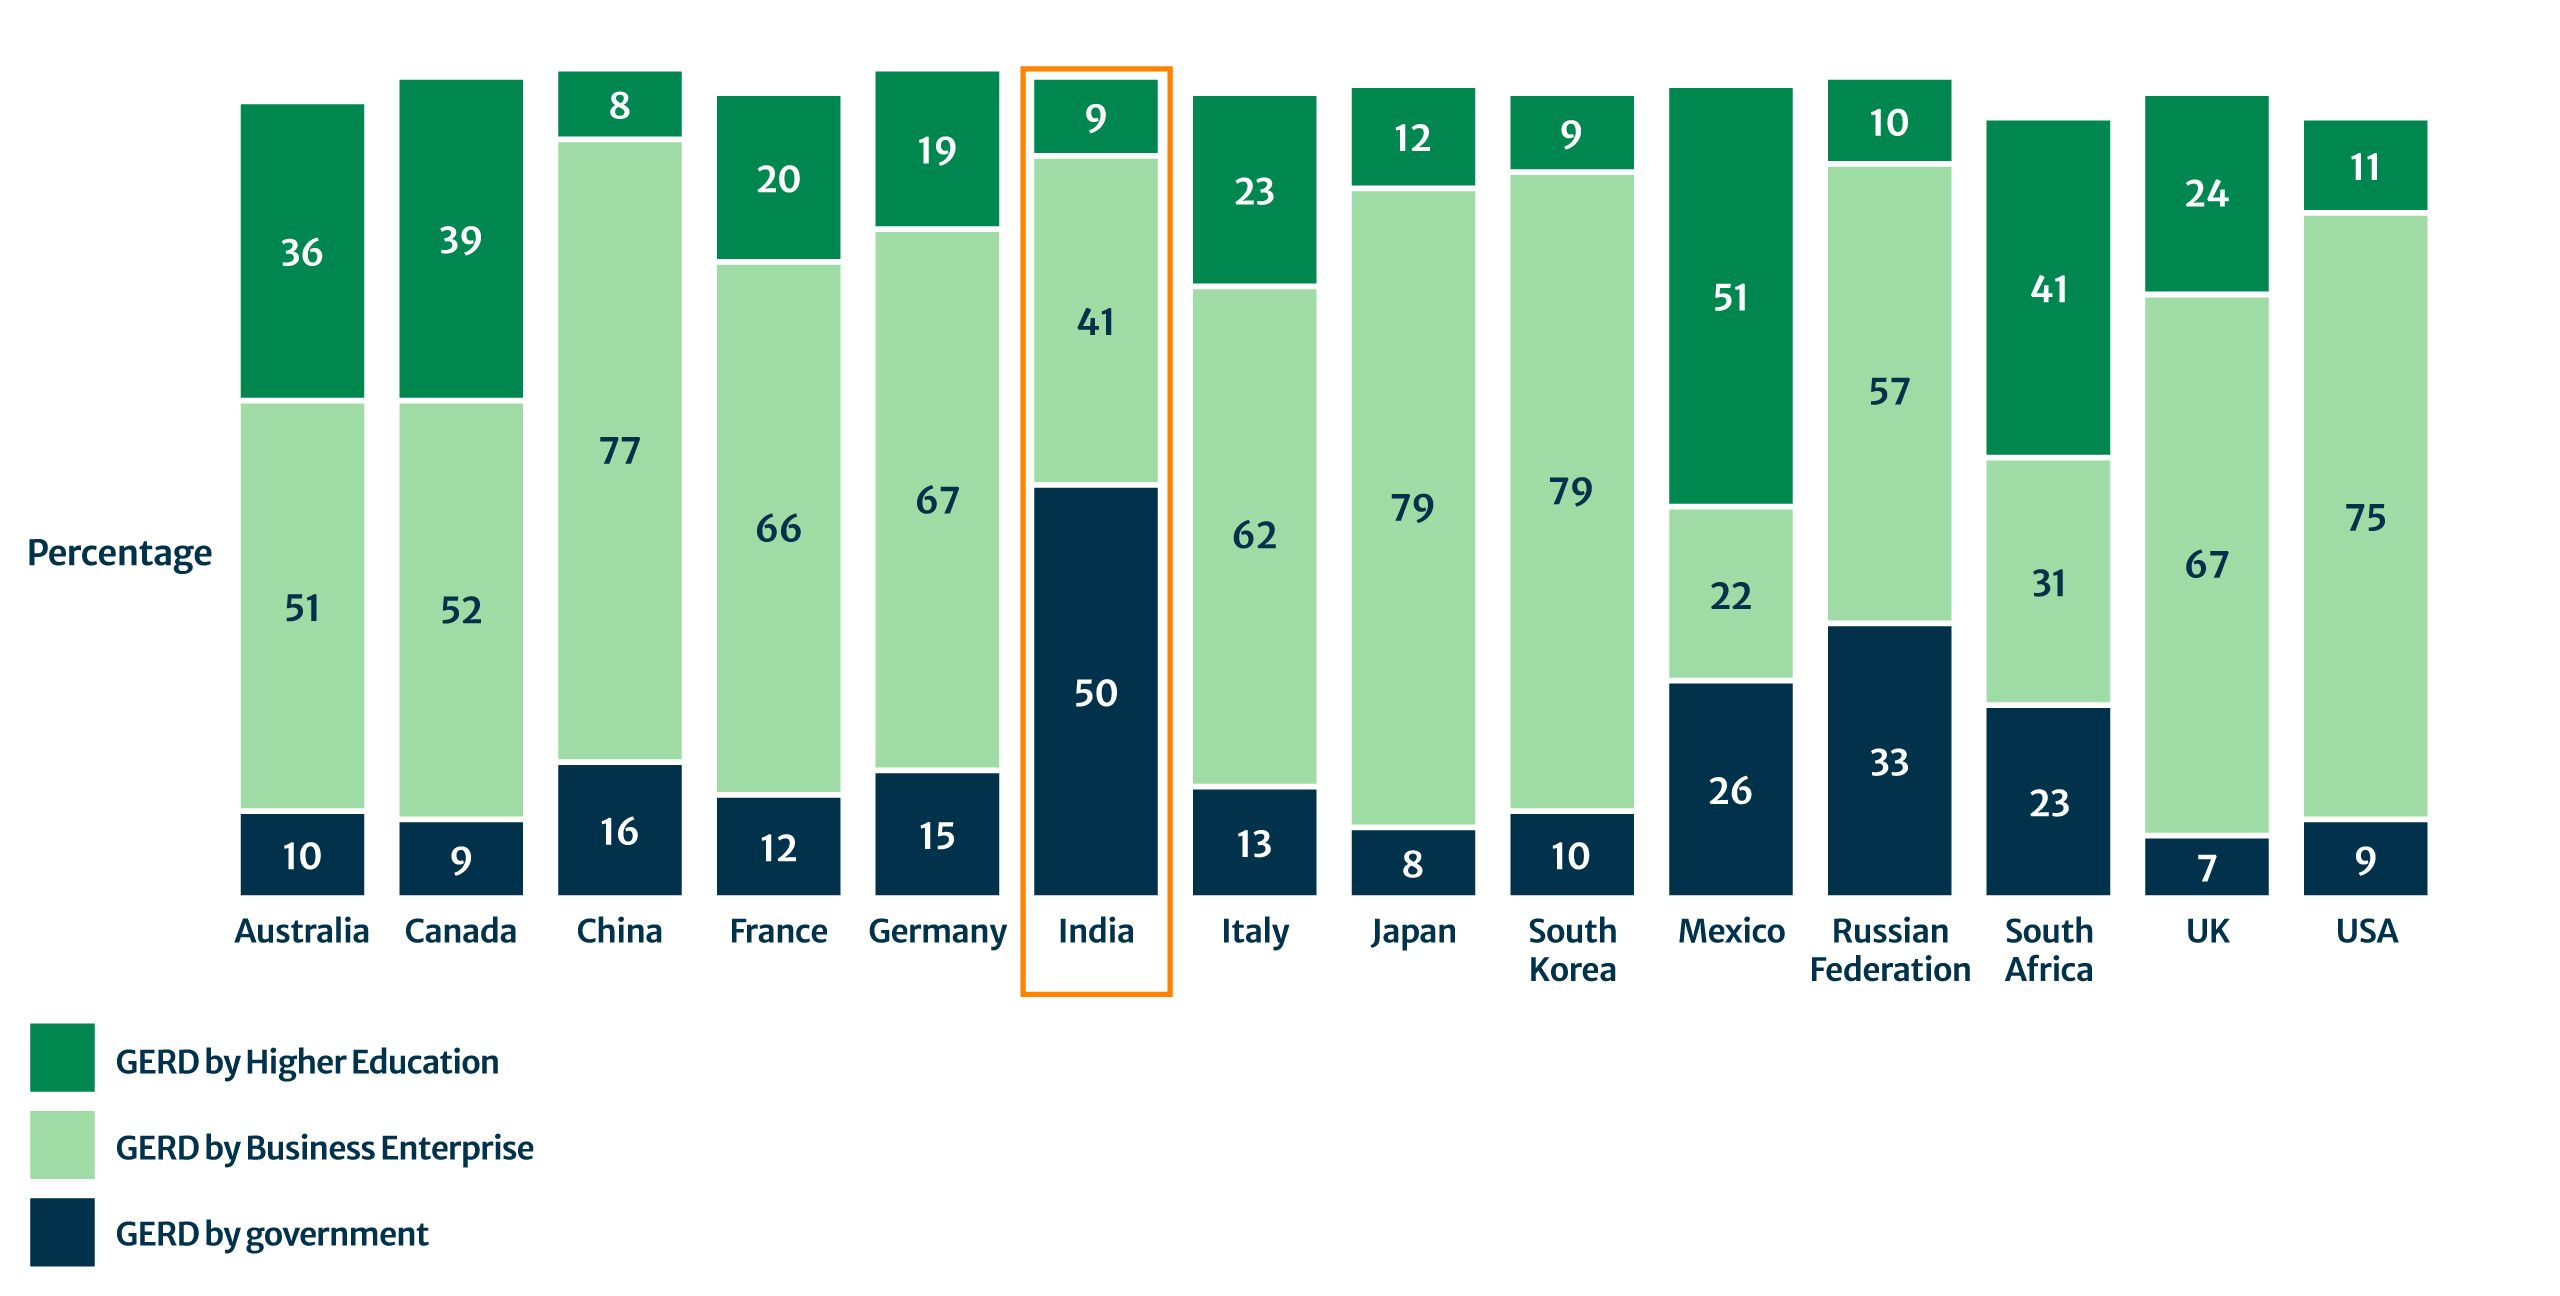
Table 10: Participation of government, business enterprise and higher education in gross domestic expenditure on research and development (GERD) by country, 2020
|
Country/territory |
GERD by Higher Education (%) |
GERD by Business Enterprise (%) |
GERD by government (%) |
|---|---|---|---|
|
Australia |
36 |
51 |
10 |
|
Canada |
39 |
52 |
9 |
|
China |
8 |
77 |
16 |
|
France |
20 |
66 |
12 |
|
Germany |
19 |
67 |
15 |
|
India |
9 |
41 |
50 |
|
Italy |
23 |
62 |
13 |
|
Japan |
12 |
79 |
8 |
|
South Korea |
9 |
79 |
10 |
|
Mexico |
51 |
22 |
26 |
|
Russian Federation |
10 |
57 |
33 |
|
South Africa |
41 |
31 |
23 |
|
UK |
24 |
67 |
7 |
|
USA |
11 |
75 |
9 |
India is ranked 39th among 133 world economies in the Global Innovation Index (GII) 2024.
The low private sector involvement in India suggests there is room for further quality growth as R&D expands. There are signs of this growth emerging, notably in computing, biotechnology and health, and engineering and manufacturing. India’s large pool of tech talent and cost-effective operations make it an increasingly attractive destination for multinational companies setting up R&D centres.xiii
The Global Innovation Index (GII) 2025 shows year-on-year innovation growth in India, which ranked 38th among 133 world economies in 2025.xiv This places India as 1st among the lower-middle-income group economies tracked in the GII, and 1st among the 10 economies in Central and Southern Asia. Its strongest performance in the GII is in knowledge and technology outputs, which track the ability to translate innovation into tangible outputs such as patents, scientific publications, and the export of high-tech goods and services. India now hosts four of the world’s top 100 science and technology clusters: Bengaluru, Delhi, Chennai, and Mumbai.xv
2.2. Initiatives that strengthen international collaboration
India’s expanding R&D ecosystem is also drawing increasing levels of international collaboration. The proportion of India’s publications co-authored with researchers abroad grew from 23% to 36% over the last decade. Top collaborators include the USA, Saudi Arabia, UK, Mainland China, and South Korea.xvi
The proportion of India’s publications co-authored with researchers abroad grew from 23% to 36% over the last decade.
For example, the US National Science Foundation (NSF) and Indian science agencies jointly announced 35 awards in 2023, fostering progress in artificial intelligence (AI), quantum technologies, military, and space research.xvii More recently, the 2025 TRUST (“Transforming the Relationship Utilizing Strategic Technology”) initiative and INDUS Innovation scheme are placing renewed focus on academic and private sector partnerships in areas such as defence, artificial intelligence, semiconductors, quantum, biotechnology, energy, and space.xviii
The UK and India have also signed agreements to collaborate on science and innovation, focusing on various areas such as climate change, pandemic preparedness, and AI.xix Since 2008, UK Research and Innovation (UKRI) has invested over £400 million in more than 250 projects, including vaccine development and AI applications.xx
These partnerships are delivering real impact. Consistent with the CNCI analysis shown here, a report from UKRI found citation impact of more than double the global average and higher than either country’s average.xxi
2.3. Supporting knowledge exchange in higher education
India’s research capacity is underpinned by its sizeable higher education ecosystem, home to over 40 million students.xxii With over 1,162 universities, up from 750 a decade ago, India is the world’s third-largest producer of PhD graduates.xxiii, xxiv There has been substantial growth in the number of students, in part due to India’s National Education Policy, launched in 2020.xxv Part of this strategy is to merge single-discipline higher education institutes into multidisciplinary universities and double higher-education enrolment to around 75 million students by 2040.xxvi
The National Education Policy strategy also encourages links and programmes with the top 500 institutions worldwide to make India a global destination for foreign students and faculty members. Two Australian universities, Deakin University and Wollongong University, announced in 2023 that they would be the first institutions to set up campuses.xxvii
Nature Index also reports that India has rolled out scholarships and fellowships aimed at encouraging science and technology education. Science is being promoted at the school level, with a view to building a long-term pipeline of future researchers.xxviii
2.4. National commitment to Open Science
India’s One Nation One Subscription (ONOS) initiative is a landmark commitment to Open Science.xxix It provides national-level access to over 13,000 journals across 30 publishers at 7,200 institutions and is expected to empower 18 million researchers, students, and educators.
A total budget of 6,000 crore (~$720 million) for subscription journals has been allocated for 3 years. Notably, the ONOS has allocated an additional 150 crore (~€18 million) per year to support article processing charges (APCs), expanding the number of Indian researchers who can now benefit from the increased usage, citation, and engagement associated with open access publications.
Springer Nature is a signatory to ONOS, enabling Indian authors in our journals to leverage all these benefits.
2.5. Upholding research integrity
India has seen 0.1-0.3% of total output retracted and has responded with policies and infrastructure to reinforce standards. For example:
- India’s National Institutional Ranking Framework (NIRF) has announced that it will penalize universities with high retraction numbers. The move is aimed at curbing academic misconduct by punishing unethical research practices.xxx
- The University Grants Commission has undertaken retrospective quality reviews of PhD theses to curb low-quality publishing.xxxi
- Many colleges have introduced formal research methodology training, including grants to selected postgraduates to support this annually.xxxii
Together, these efforts indicate a growing national focus on research excellence and alignment with international norms.
3. Navigating
the Indian
research
landscape


With over 54,000 public and private colleges and more than 1,000 PhD-granting institutions, India’s research landscape is large, diverse, and complex. Institutions range from elite research universities and specialist science institutes to regional colleges focused on teaching. This section highlights sources that editors can rely on to identify research excellence within this vast nation.
3.1. World-leading rankings
Formal rankings offer a useful filter to compare institutions internationally. Nature Index’s 2025 Research Leaders identified India’s strengths in specific fields, particularly chemistry and the natural sciences.
Top-performing institutions in the Nature Index include the Indian Institute of Science (IISc), Indian Institutes of Technology (IITs), and National Institutes of Technology (NITs). Institutions like IISER Kolkata and IIT Guwahati are showing year-on-year increases in their ranking, an indicator of rising output and impact in top journals.
Table 11: Nature Index university rankings: top ten ranked universities in India, 2025
|
Position |
Institution |
Share 2023 |
Share 2024 |
Count 2024 |
Change in Adjusted Share 2023–2024 |
|---|---|---|---|---|---|
|
1 |
Indian Institute of Science (IISc), India |
96.17 |
103.44 |
218 |
-7% |
|
2 |
Indian Institute of Technology Bombay (IIT Bombay), India |
69.10 |
78.04 |
158 |
-3% |
|
3 |
Homi Bhabha National Institute (HBNI), India |
63.17 |
74.62 |
245 |
2% |
|
4 |
Council of Scientific and Industrial Research (CSIR), India |
66.76 |
69.61 |
195 |
-10% |
|
5 |
Indian Institute of Technology Guwahati (IIT Guwahati), India |
51.14 |
68.03 |
92 |
15% |
|
6 |
Indian Institute of Technology Kanpur (IIT Kanpur), India |
41.96 |
65.25 |
117 |
34% |
|
7 |
Tata Institute of Fundamental Research (TIFR), India |
64.50 |
59.22 |
187 |
-21% |
|
8 |
Indian Institute of Science Education and Research Pune (IISER Pune), India |
39.26 |
56.79 |
135 |
25% |
|
9 |
Indian Institute of Science Education and Research Kolkata (IISER Kolkata), India |
56.75 |
56.65 |
97 |
-14% |
|
10 |
Indian Institute of Science Education and Research Bhopal (IISER Bhopal), India |
46.10 |
54.93 |
82 |
3% |
Similarly, the QS Asia university rankings (Table 12) and Times Higher Education (THE) World University Rankings (Table 13) feature a range of Indian institutions across sciences, social sciences, and interdisciplinary areas.
Table 12: QS Asia University Rankings: top ten ranked universities in India, 2025
|
Index |
2025 rank |
2024 rank |
Institution |
|---|---|---|---|
|
44 |
44 |
46 |
Indian Institute of Technology Delhi (IITD) |
|
48 |
=48 |
40 |
Indian Institute of Technology Bombay (IITB) |
|
56 |
56 |
53 |
Indian Institute of Technology Madras (IITM) |
|
60 |
60 |
59 |
Indian Institute of Technology Kharagpur (IIT-KGP) |
|
62 |
62 |
58 |
Indian Institute of Science |
|
67 |
=67 |
63 |
Indian Institute of Technology Kanpur (IITK) |
|
82 |
=81 |
=94 |
University of Delhi |
|
104 |
104 |
111 |
Indian Institute of Technology Guwahati (IITG) |
|
109 |
=108 |
116 |
Indian Institute of Technology Roorkee (IITR) |
|
110 |
110 |
117 |
Jawaharlal Nehru University |
Table 13: THE top ten ranked universities in India, 2025
|
India Rank 2025 |
WUR Rank 2025 |
University |
Overall |
Teaching |
Research Environment |
Research Quality |
Industry |
International Outlook |
|---|---|---|---|---|---|---|---|---|
|
1 |
201–250 |
Indian Institute of Science |
55.8–58.6 |
61.4 |
56.6 |
53.7 |
97.3 |
31.6 |
|
=2 |
401–500 |
Anna University |
46.0–49.2 |
36.9 |
28.7 |
76.7 |
65.8 |
20.2 |
|
=2 |
401–500 |
Mahatma Gandhi University |
46.0–49.2 |
44.6 |
36.9 |
64.8 |
34.5 |
28 |
|
=2 |
401–500 |
Saveetha Institute of Medical and Technical Sciences |
46.0–49.2 |
34 |
16 |
88.6 |
19.4 |
72.5 |
|
=2 |
401–500 |
Shoolini University of Biotechnology and Management Sciences |
46.0–49.2 |
29.9 |
21.3 |
87.2 |
22.6 |
71.4 |
|
=6 |
501–600 |
Indian Institute of Technology Indore |
43.3–45.9 |
43.6 |
27.1 |
64.5 |
35.5 |
35 |
|
=6 |
501–600 |
Jamia Millia Islamia |
43.3–45.9 |
41 |
15.8 |
78.6 |
40.9 |
40.4 |
|
=6 |
501–600 |
UPES |
43.3–45.9 |
31.6 |
21.4 |
79 |
21.3 |
54.9 |
|
=9 |
601–800 |
Aligarh Muslim University |
38.2–43.2 |
42.4 |
15.3 |
65.9 |
36.3 |
39.8 |
|
=9 |
601–800 |
Amity University, Noida |
38.2–43.2 |
27 |
14 |
74.5 |
27.4 |
40.3 |
View THE best colleges in India rankings
Other notable institutions include the All India Institutes of Medical Sciences (AIIMS) and the Tata Institutes, including the Tata Institute of Fundamental Research (TIFR) and Tata Institute of Social Sciences (TISS).
India’s SDG-focused work is another source of world-leading research. This work often originates in technical universities, public health institutes, or state-funded engineering colleges, such as Amrita Vishwa Vidyapeetham, Lovely Professional University, and JSS Academy of Higher Education and Research, which appear 41st, 48th, and 56th respectively in the 2025 THE University Impact Rankings.
3.2. Other publisher data
Publisher tools, including Scopus, Dimensions, and Web of Science, offer another route to explore more institutions by specific discipline. Given the higher impact of internationally co-authored work, editors can search by co-authorships involving Indian researchers to identify rising labs and departments.
Further reading
and References

Further reading
Nature Index 2025 Research Leaders


The Nature Index 2025 Research Leaders highlights India’s top-performing institutions in natural and health sciences, based on data from January–December 2024.
Explore Nature Index
RISE-UTTHAN initiative: “strategic collaboration to increase awareness of the importance of research integrity, open access and other scholarly publishing practices”

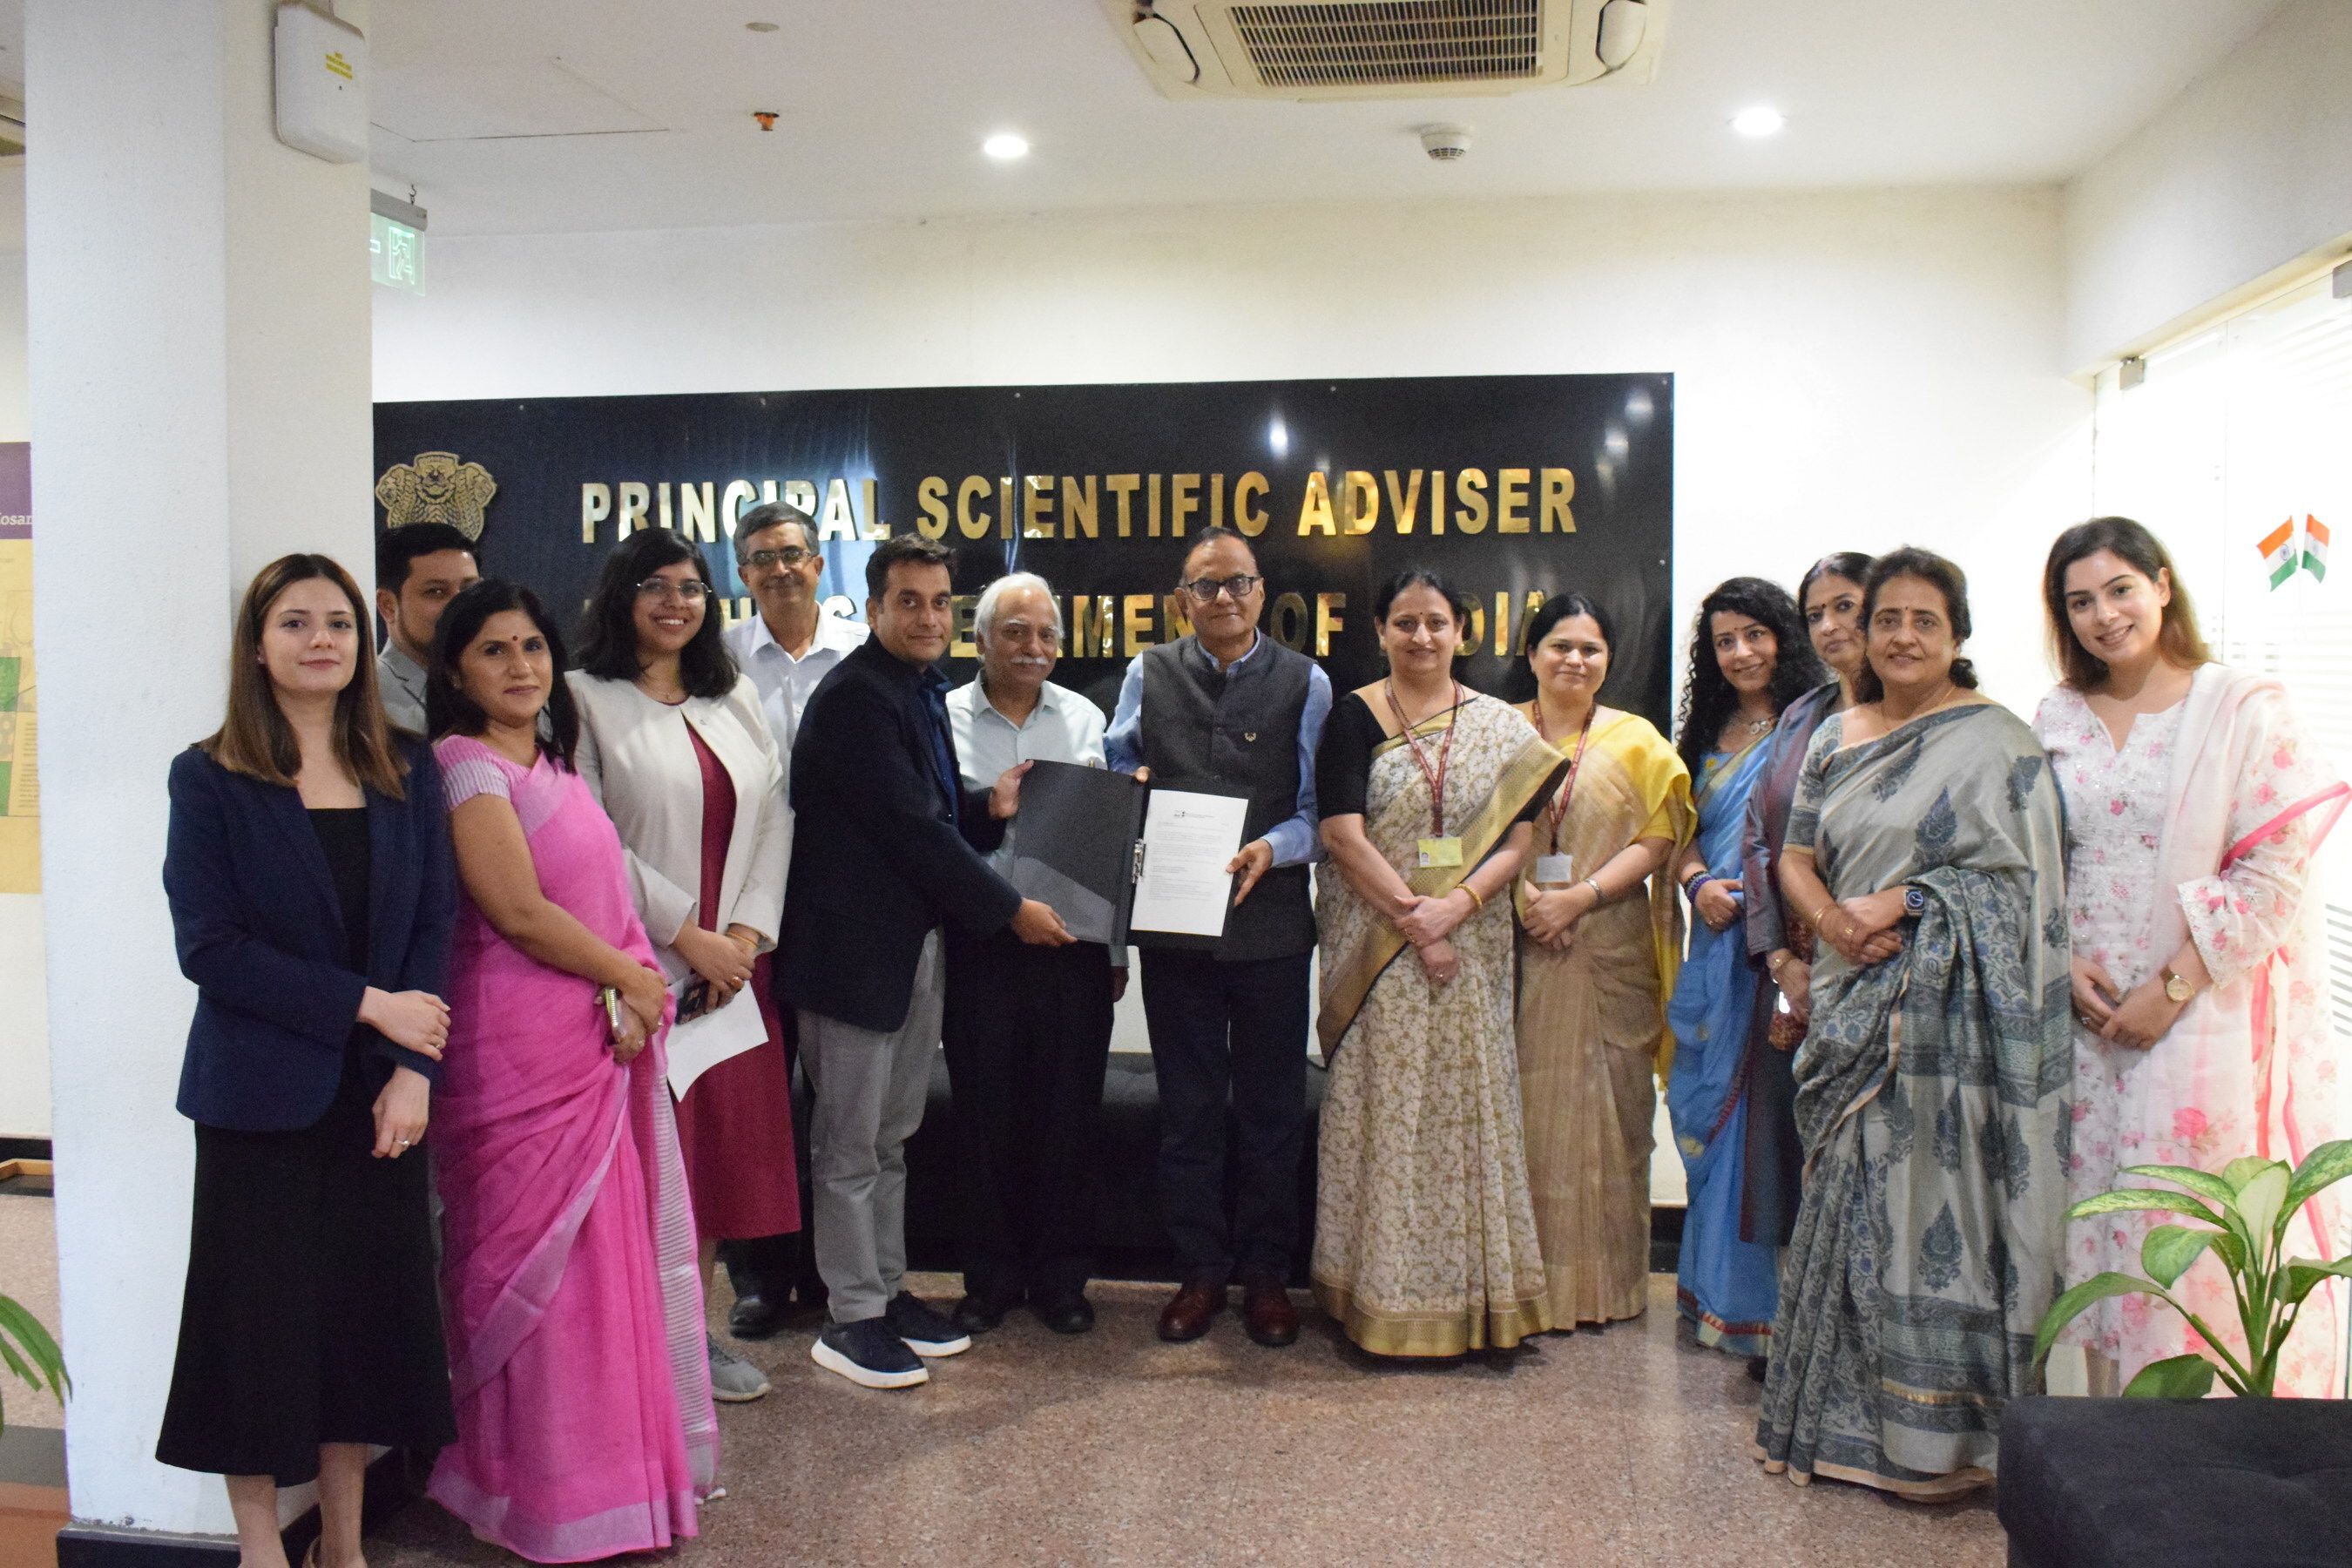
The Office of the Principal Scientific Adviser (PSA) to the Government of India and Springer Nature have launched a strategic collaboration to support research integrity, open access, and scholarly publishing capacity in India’s Tier 2 and Tier 3 institutions.
Read more from Springer Nature
Nature Index 2024 Research Leaders: India follows in China’s footsteps as top ten changes again


The Nature Index 2024 Research Leaders report highlights India’s rapid rise in global research rankings, overtaking Australia and Switzerland to reach 9th overall, and 8th in the natural sciences.
Read more from Nature Index
References
Links open in a new window
i. Nature. (2023). Spotlight: India. https://www.nature.com/collections/dcaaddacig
ii. World Bank. (2023). Researchers in R&D (per million people). https://data.worldbank.org/indicator/SP.POP.SCIE.RD.P6?locations=IN
iii. ATeam. (2024). Why is India the centre of global IT services? https://www.ateamsoftsolutions.com/why-is-india-the-centre-of-global-it-services/
iv. Ellis-Peterson, H. (2020). India at heart of global efforts to produce Covid vaccine. The Guardian. https://www.theguardian.com/world/2020/oct/20/india-at-heart-of-global-efforts-to-produce-covid-vaccine
v. Jones, A. (2023). Chandrayaan-3: India becomes fourth country to land on the moon. Space News. https://spacenews.com/chandrayaan-3-india-becomes-fourth-country-to-land-on-the-moon/
vi. Rogers, G. (2025). Insights from the G20 Scorecard: India’s Research Performance in Focus. Clarivate. https://clarivate.com/academia-government/blog/insights-from-the-g20-scorecard-indias-research-performance-in-focus/
vii. Nature Index. (2024). Nature Index 2024 Research Leaders. https://www.nature.com/nature-index/research-leaders/2024/
viii. Clarivate. (n.d.). Web of Science Core Collection: Editorial Selection Process. https://clarivate.com/academia-government/scientific-and-academic-research/research-discovery-and-referencing/web-of-science/web-of-science-core-collection/editorial-selection-process/
ix. Clarivate. (2025). G20 Research and Innovation Scorecard 2025. https://clarivate.com/academia-government/the-institute-for-scientific-information/2025-g20-scorecard/
x. Nature Index. (2025). Nature Index 2025 Research Leaders. https://www.nature.com/nature-index/research-leaders/2025/
xi. Nature Index. (2025). Country outputs: India. https://www.nature.com/nature-index/country-outputs/India
xii. World Bank. (2023). Research and Development Expenditure (% of GDP). https://data.worldbank.org/indicator/GB.XPD.RSDV.GD.ZS?name_desc=false
xiii. Statista. (2024). Research and Development (R&D) in India. https://www.statista.com/topics/12602/research-and-development-in-india/
xiv. WIPO. (2025). India in the Global Innovation Index 2025. https://www.wipo.int/gii-ranking/en/india
xv. WIPO. (2023). Global Innovation Index: Science and Technology Clusters 2023. https://www.wipo.int/global_innovation_index/en/2023/science-technology-clusters.html
xvi. Clarivate. (2025). G20 Research and Innovation Scorecard 2025. https://clarivate.com/academia-government/the-institute-for-scientific-information/2025-g20-scorecard/
xvii. Gilbert, N. (2023). United States and India are becoming science partners of choice. Nature. https://www.nature.com/articles/d41586-023-03443-2
xviii. The White House. (2025). United States–India Joint Leaders’ Statement. https://www.whitehouse.gov/briefings-statements/2025/02/united-states-india-joint-leaders-statement/
xix. ANI. (2023). India, UK sign agreement to collaborate on science and innovation. The Economic Times. https://economictimes.indiatimes.com/news/science/india-uk-sign-agreement-to-collaborate-on-science-and-innovation/articleshow/99807246.cms
xx. Fallon, S. (2024). UK Science & Innovation Network Summary: India. UK Science & Innovation Network. https://assets.publishing.service.gov.uk/media/6630caaece3f1dd574cad210/SIN_India_Summary_April_2024.pdf
xxi. Gov.uk. (2021). New report reveals real-world impact from UK–India research and innovation partnership. https://www.gov.uk/government/news/new-report-reveals-real-world-impact-from-uk-india-researchand-innovation-partnership
xxii. Statista. (2025). Higher education in India – statistics & facts. https://www.statista.com/topics/9047/tertiary-education-in-india
xxiii. Plackett, B. (2024). Nature Index 2024 Research Leaders: India follows in China’s footsteps as top ten changes again. Nature Index. https://www.nature.com/nature-index/news/nature-index-research-leaders-india-follows-china-footsteps
xxiv. Highwire. (2024). India rising: a new frontier in scholarly publishing. https://www.highwirepress.com/blog/india-rising-alpsp-notes-2024/
xxv. Government of India. (2020). National Education Policy. https://www.education.gov.in/sites/upload_files/mhrd/files/NEP_Final_English_0.pdf
xxvi. Gilbert, N. (2023). United States and India are becoming science partners of choice. Nature. https://www.nature.com/articles/d41586-023-03443-2
xxvii. Lem, P. (2023). Deakin and Wollongong are first to open Indian branch campuses. Times Higher Education. https://www.timeshighereducation.com/news/deakin-and-wollongong-are-first-open-indian-branch-campuses
xxviii. Plackett, B. (2024). Nature Index 2024 Research Leaders: India follows in China’s footsteps as top ten changes again. Nature Index. https://www.nature.com/nature-index/news/nature-index-research-leaders-india-follows-china-footsteps
xxix. Government of India. One Nation One Subscription (ONOS) Dashboard. https://www.onos.gov.in/instituteDashboard
xxx. Priyadarshini, S. (2025). India’s research retraction surge sparks call for reform. Nature India. https://www.nature.com/articles/d44151-025-00141-y
xxxi. Hulagabali, S.C. (2019). India’s retrospective review of PhD research quality is set to significantly change research practices. LSE Impact Blog. https://blogs.lse.ac.uk/impactofsocialsciences/2019/08/09/indias-retrospective-review-of-phd-research-quality-is-set-to-significantly-change-research-practices/
xxxii. Kapoor, A. (2019). Quality medical research and publications in India: Time to introspect. International Journal of Applied & Basic Medical Research, 9, 67–68.
https://pmc.ncbi.nlm.nih.gov/articles/PMC6477952/
Authors
Darren Byrne
Senior Publishing Manager
Ritu Dhand
Chief Scientific Officer
Springer Nature
Aman Ganpatsingh
Senior Content Marketing Manager
Mithu Lucraft
Senior Consultant
TBI Communications
How to cite this report
Springer Nature (2025, November). Global Research Pulse: India Report
