Global
Research
Pulse:
China


Foreword
Ritu Dhand, Chief Scientific Officer, Springer Nature
I am delighted to introduce this Global Research Pulse report, which explores China’s development as a leader in global research.
It is the first in a new series of reports from Springer Nature to support our community of Editors, providing them with insights and tools to make informed decisions in a rapidly changing, diverse research landscape.
China is now the largest contributor to global research output, a position that has been achieved through comprehensive and strategic investment in continuous growth of funding to its universities, state-of-the-art facilities, and active recruitment of global talent to their universities.1 Engagement in emerging areas of research with real-world applications has fostered international collaboration and innovation. Meanwhile, China has also taken significant steps to increase research quality and manage research integrity issues.
In section 1, you will find data exploring China’s research growth, including indicators regarding its quality. Section 2 expands on the strategy underlying China’s accomplishments, including investment, and crucial policy shifts to increase research quality. Section 3 takes a closer look at how to identify world-leading institutions and high-impact researchers from the region.


Ritu Dhand
Chief Scientific Officer
Springer Nature
1. China’s
growing
research
quality


China’s growth in research volume has been widely documented. In recent years, reports from the US National Science Foundation,2 and Japan’s National Institute of Science and Technology Policy (NISTEP)3 have described the growth in research articles from China, which surpassed the USA in research volume in 2017. In a 2023 report, Clarivate documented a five-fold increase in China’s publication output from 2009 to 2021,4 outperforming the USA and several EU nations.
These reports also highlight an increase in the volume of citable research over the past two decades. As one metric for quality, higher levels of research citations from China shows increased attention from the international research community.
Higher levels of research citations from China shows increased attention from the international research community.
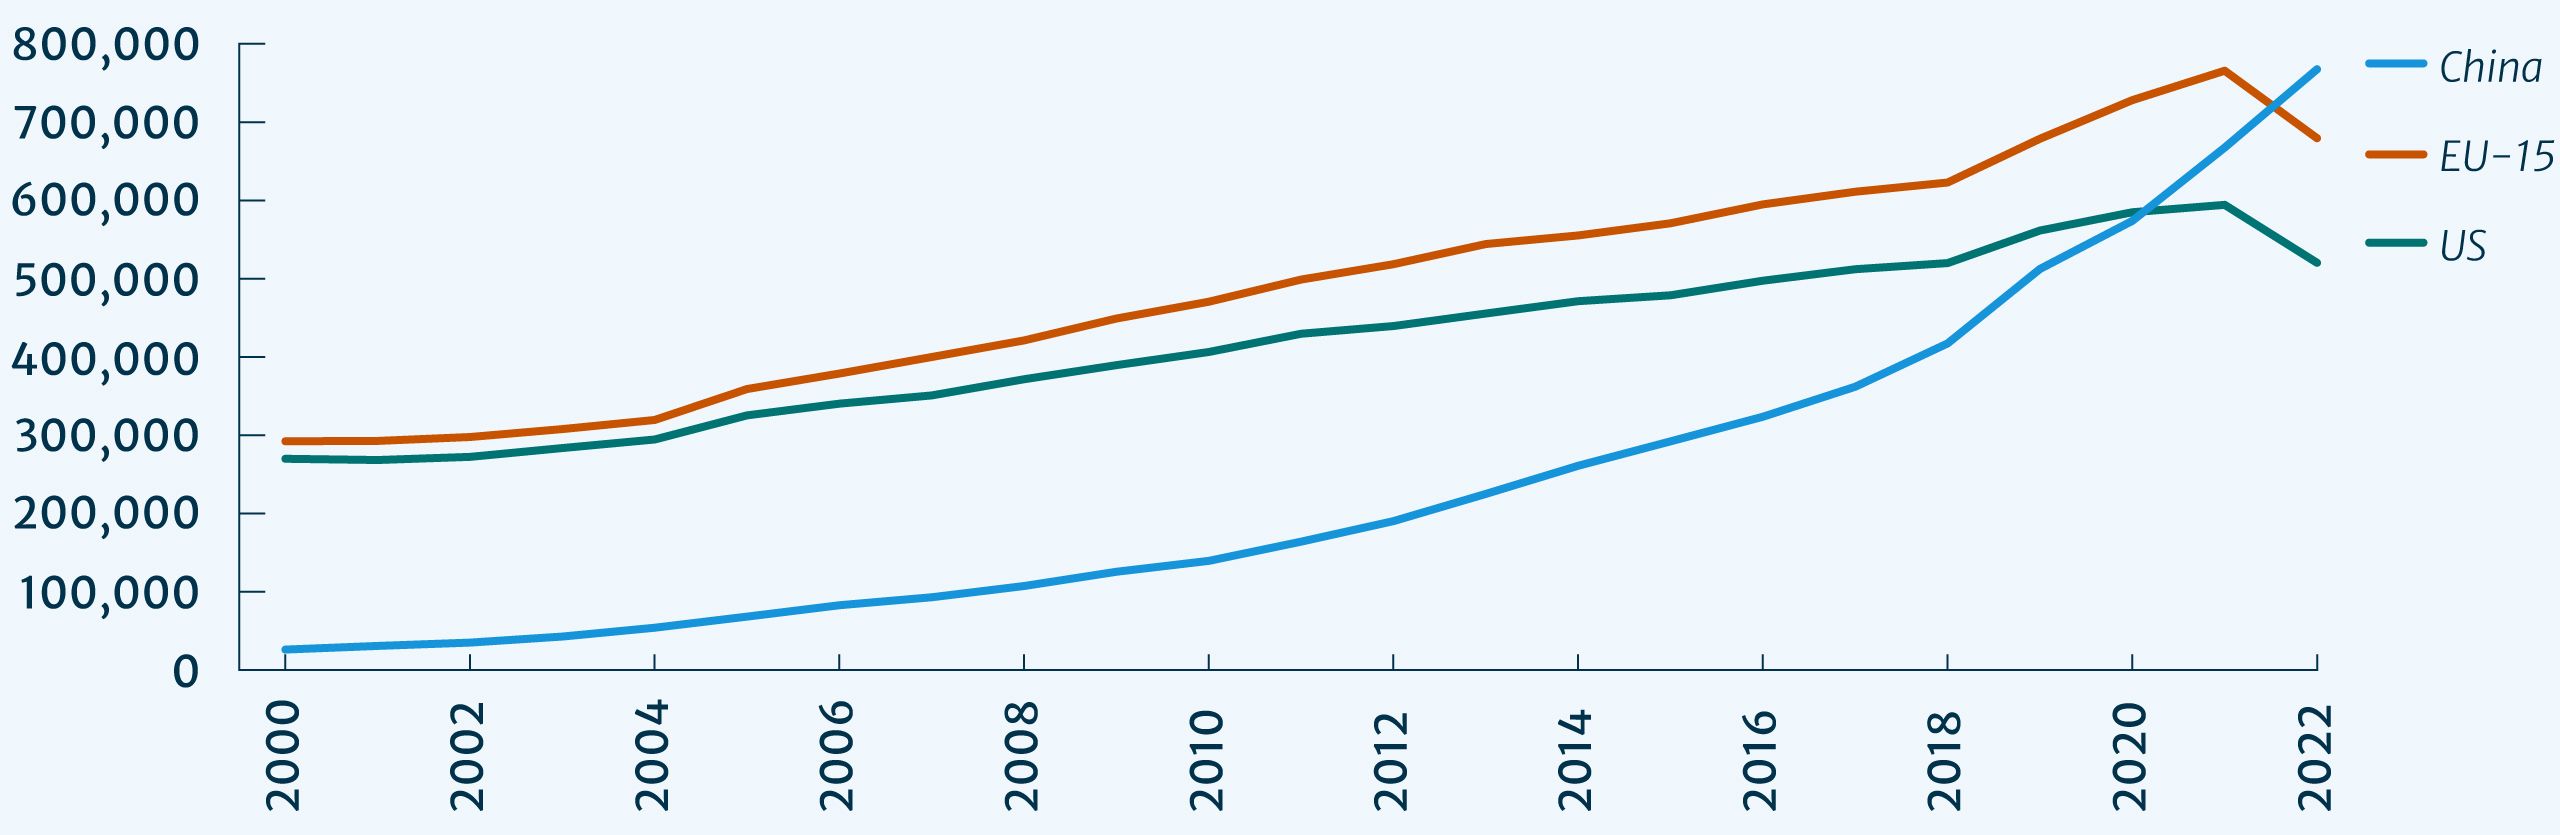
Using Clarivate InCites, the analysis shows that China has experienced a rapid increase in the number of citable research papers, and now produces the highest volume of citable papers, 40% more than the USA. (Fig.1)
Figure 1: Comparison of citable research papers from China, the USA and EU-155 between 2000 and 2022.


Other recent reports present similar evidence. In 2022, NISTEP reported that Chinese research constituted 27.2% of the world’s top 1% most frequently cited papers, looking at yearly averages between 2018 and 2020. The USA accounted for 24.9% of papers in the same period.6
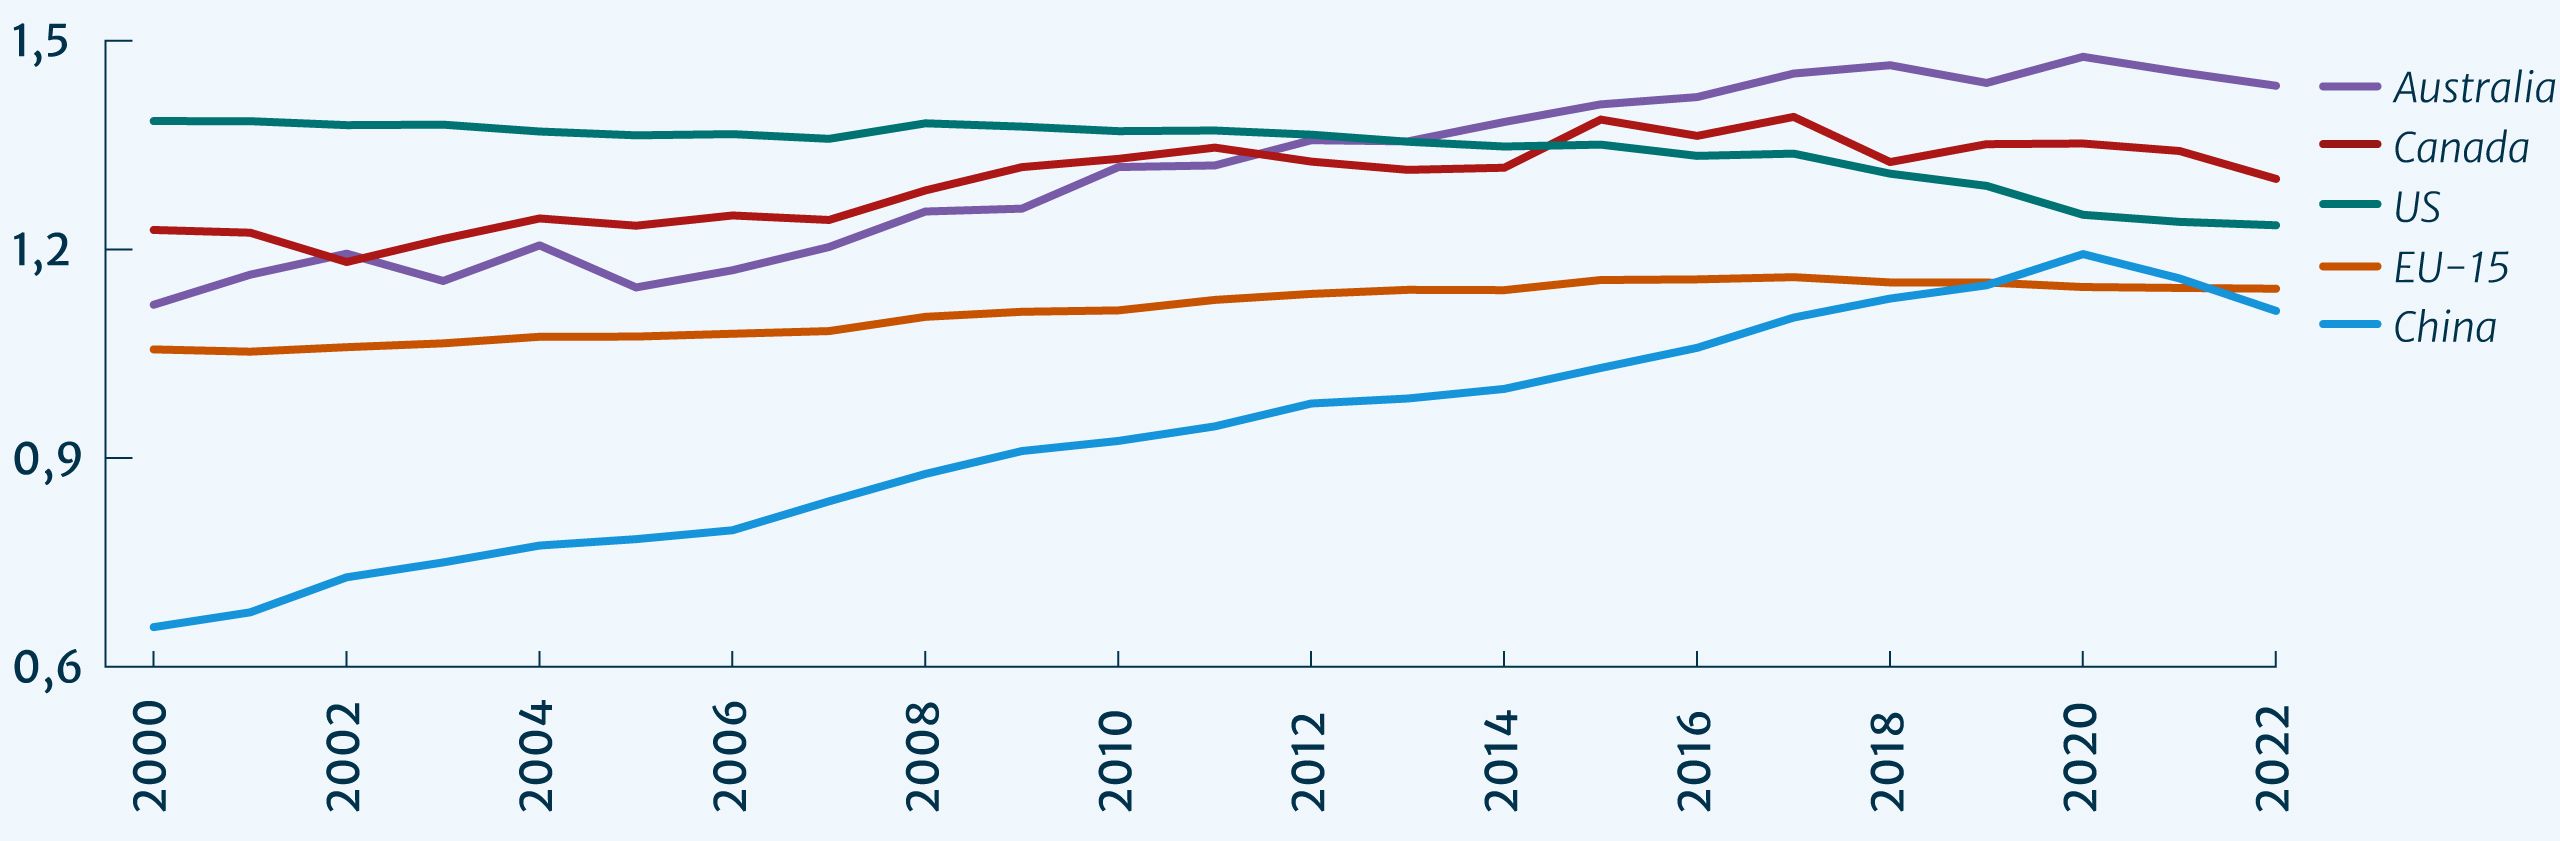
To compare citation impact across fields, we can use Clarivate’s Category Normalized Citation Impact (CNCI), which shows that China’s research impact has been steadily increasing since 2000 and is now comparable with much of Europe and the USA (Fig.2). As Clarivate’s recent report also concludes, the annual average CNCI for China indicates that each year’s research is increasingly valued abroad.7
China’s research impact has been steadily increasing since 2000 and is now comparable with much of Europe and the USA
Figure 2: Comparison of CNCI in China, US, EU-15, Canada and Australia between 2000 and 2022.


Clarivate’s Highly Cited Papers 2023 report also concludes that the global research community is increasingly taking note of China’s research: in several research fields, China now contributes as many or more Highly Cited Papers as the USA and other leading research nations.8
China now contributes as many or more Highly Cited Papers as the USA and other leading research nations.
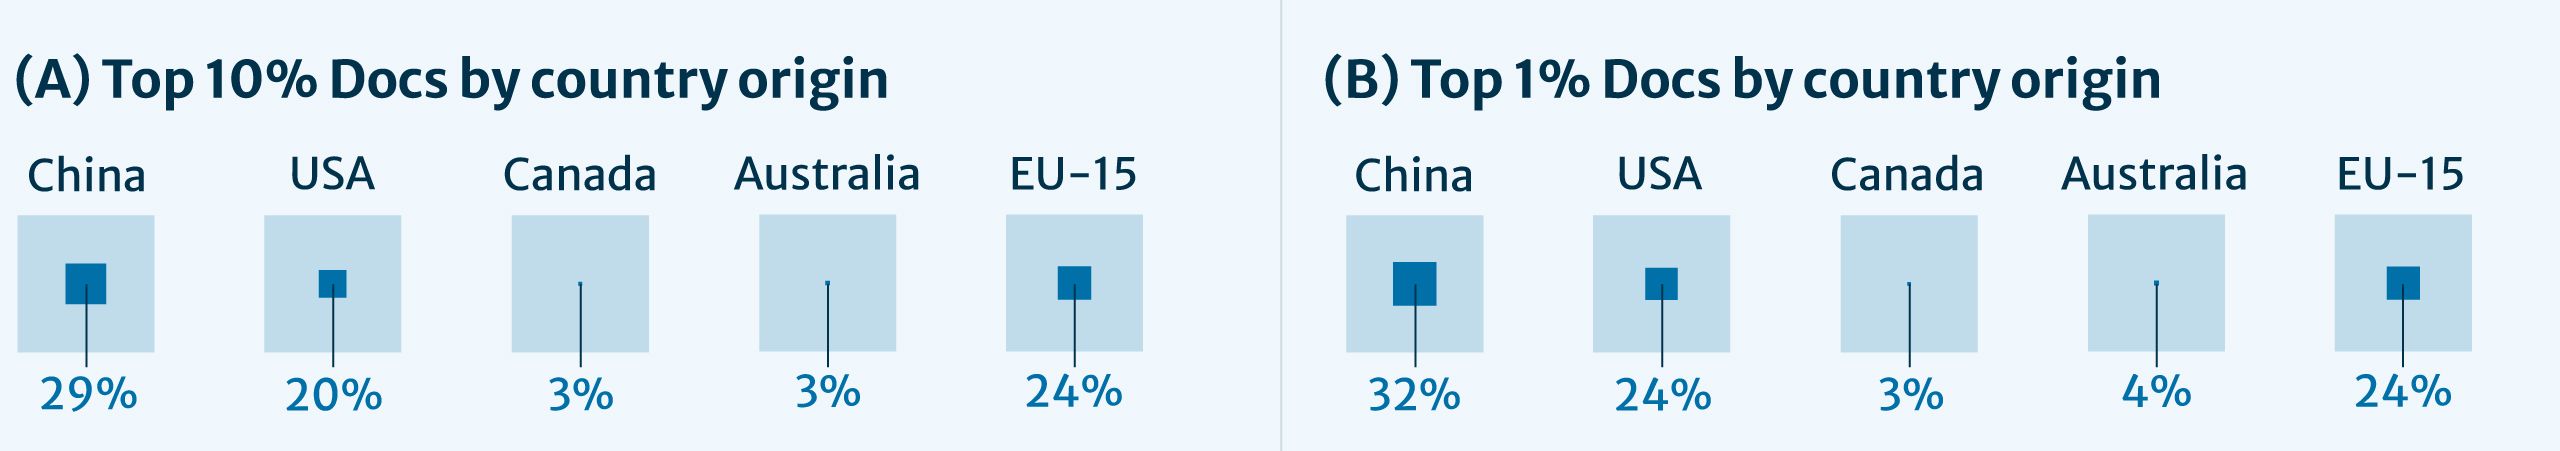
We looked at the most cited papers from 2021 in Clarivate InCites, comparing China against other countries with high research output.9 We found that China has the highest proportion of papers in the top 10% most cited, with 29% having a corresponding author from China, compared to 20% from the USA and 24% from EU-15 (Fig. 3). It also has the highest proportion of papers in the top 1% most cited, with 32% from China, compared with 24% from both the USA and EU-15 countries. (Fig. 3)
Figure 3: Proportions of most cited papers from China, USA, Canada, Australia and EU-15. (A) Top 10%; (B) Top 1%.


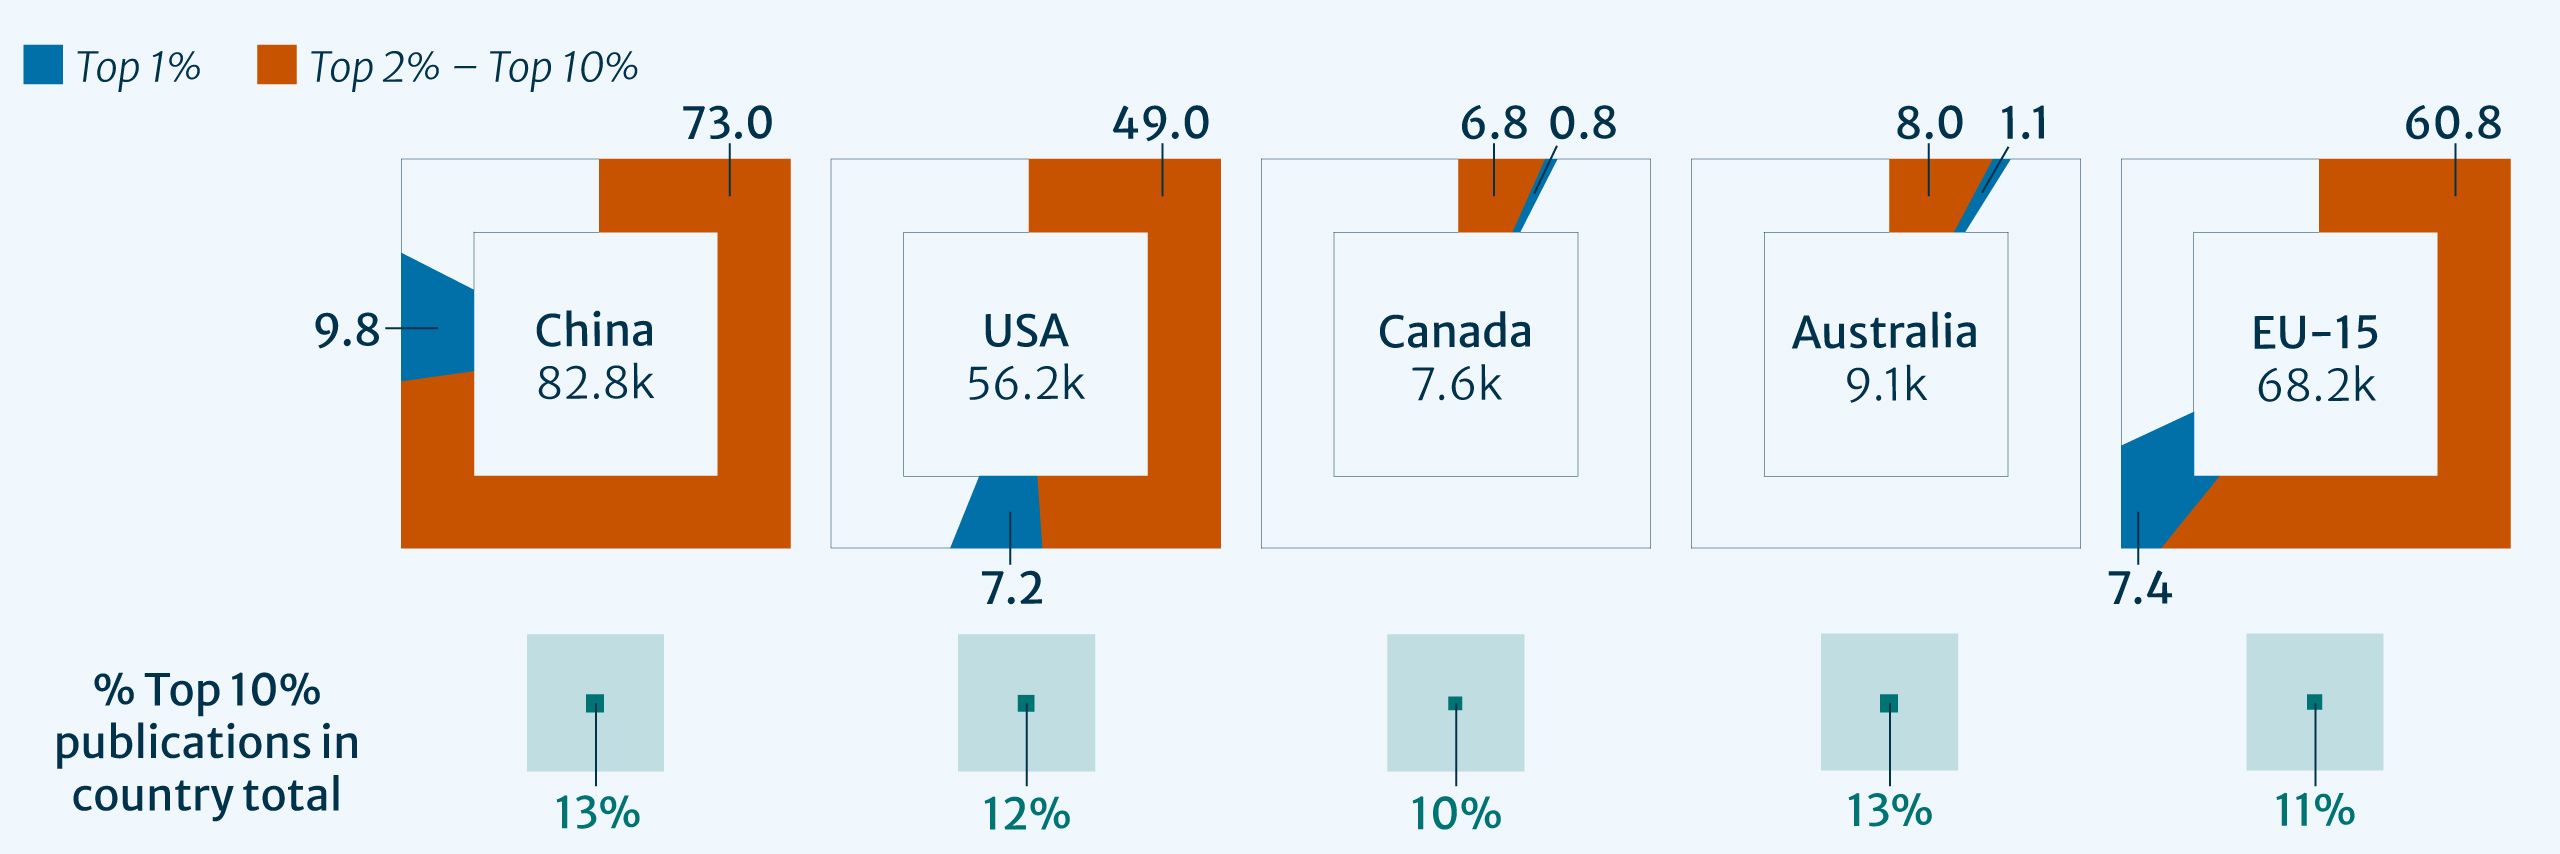
Notably, a sizeable proportion of China’s publications are in the top 10% of all Highly Cited Papers (Fig. 4). As a percentage of total research output, 13% of China’s total research output sits in the top 10% of highly cited articles, on par with the USA (12%) and EU-15 (11%).
A large proportion of China’s publications are in the top 10% of all Highly Cited Papers.
Figure 4: Volume of papers in the top 10% and top 1%: China, USA, Canada, Australia and EU-15.


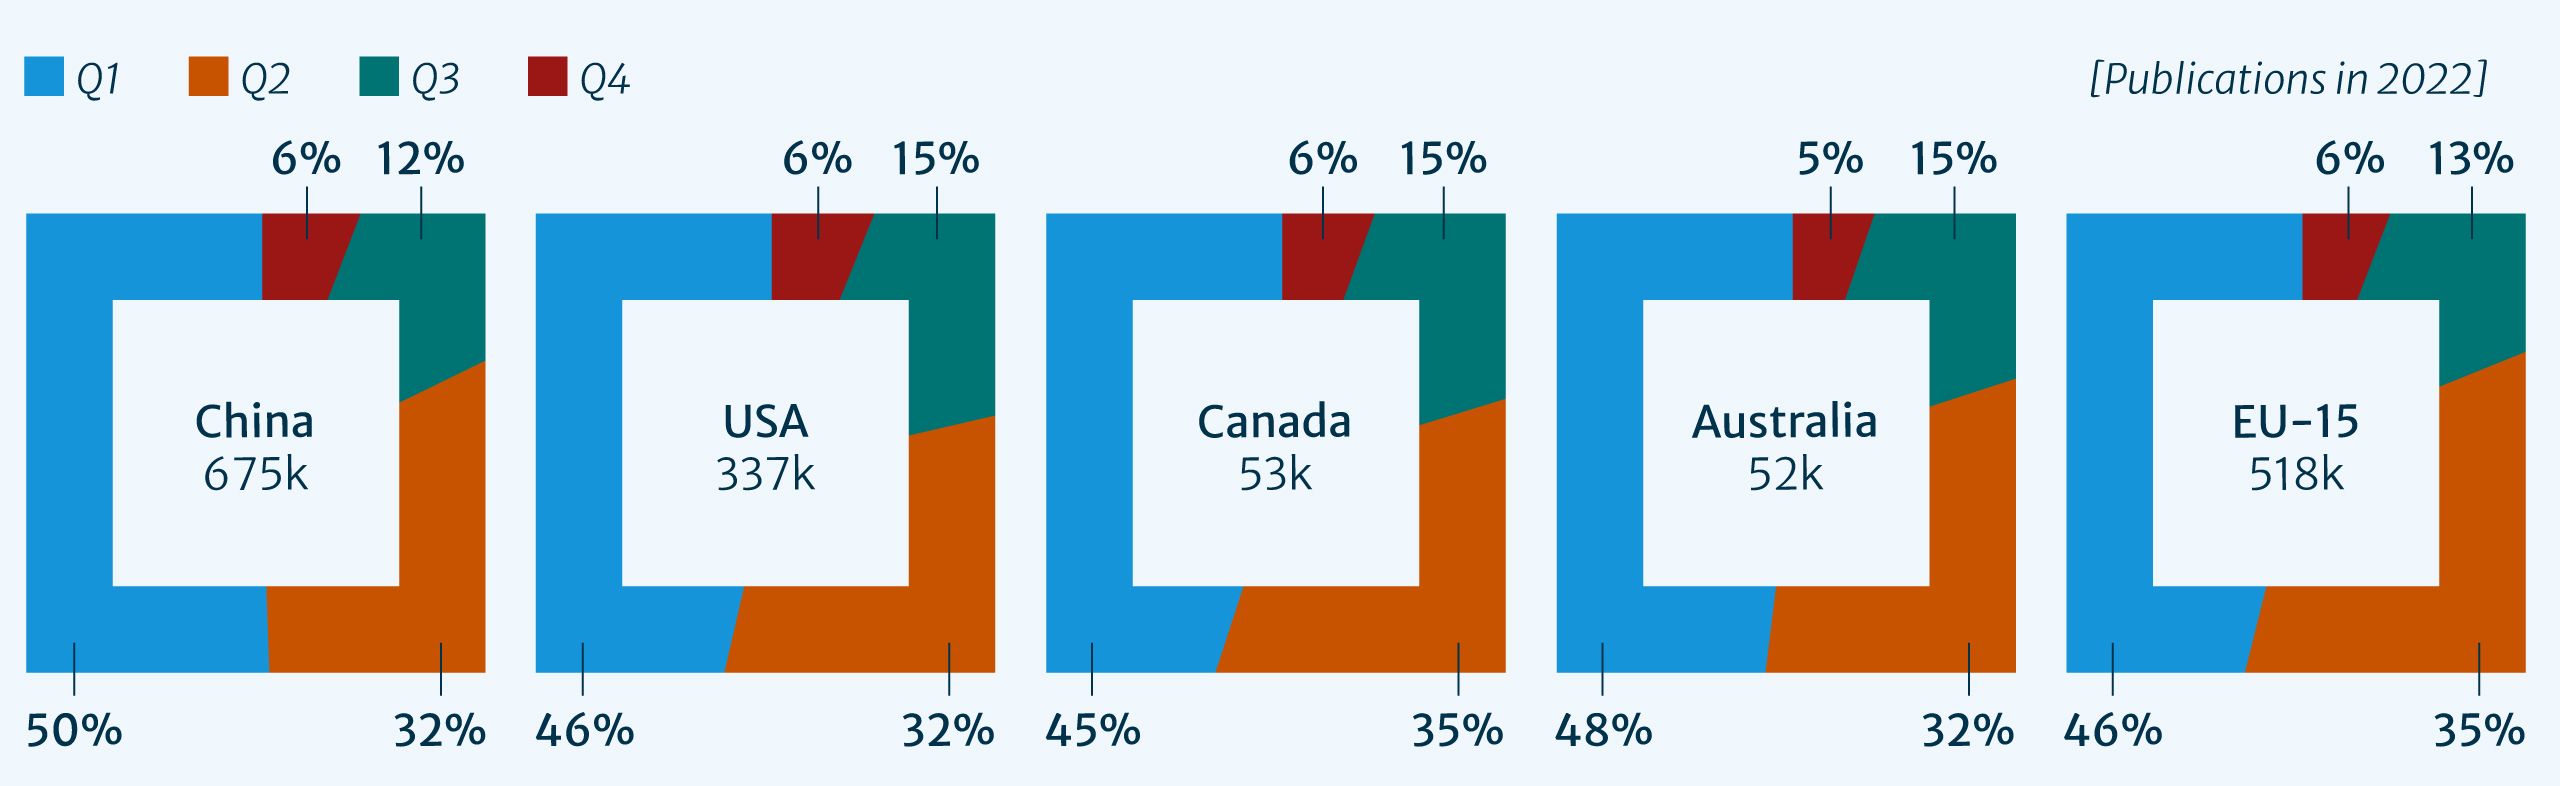
Clarivate’s Journal Citation Reports’ quartile rankings (based on the impact factors of journals) provide another means to evaluate and compare journals.10 Using the JCR impact factor for 2022, we found that 82% of papers from China are published in Q1/Q2 journals (the top 50% of all journals across all subject areas), higher than other major research nations (Fig. 5).
Figure 5: Papers published in 2022 per JCR impact factor quartiles: China, USA, Canada, Australia, EU-15.


Sub-disciplinary analysis of the global top 10% most cited papers shows China’s global standing in terms of citation impact, particularly in Engineering & Technology and the Physical Sciences (Fig. 6).
Figure 6: Contributions to top 10% of most cited papers published in 2021 by discipline.


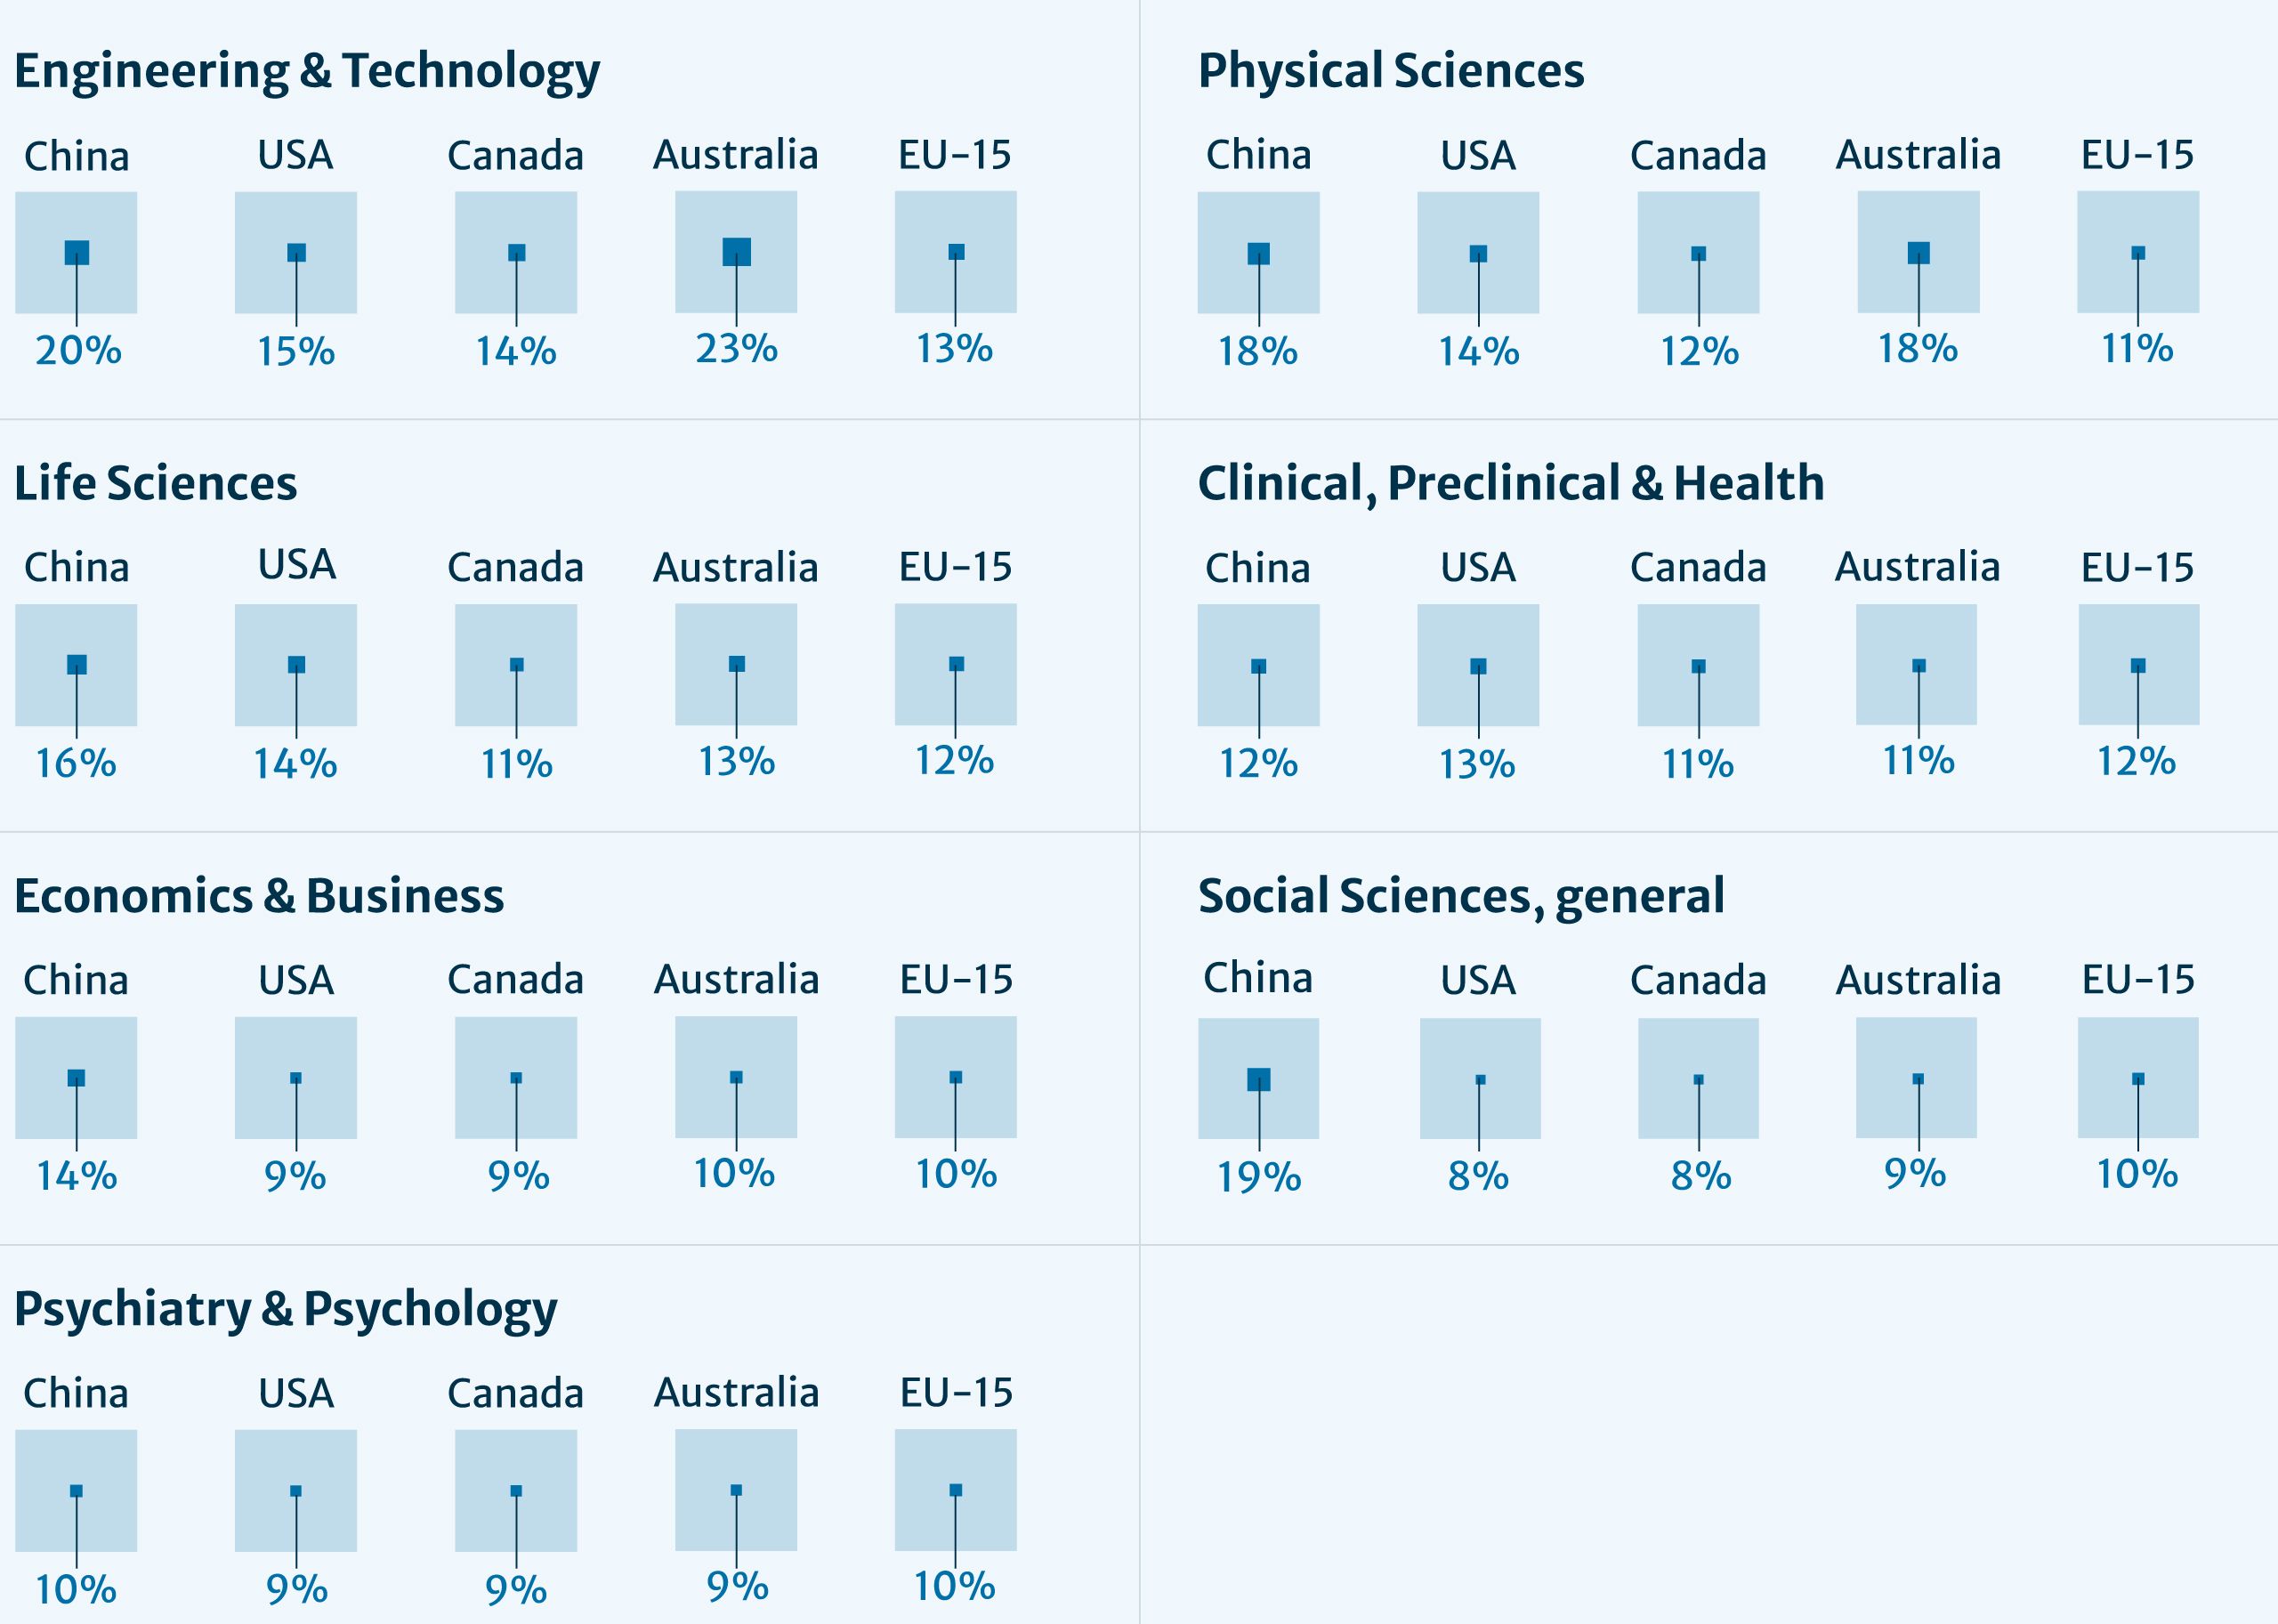
In the Physical Sciences and Engineering & Technology, China's contribution to papers ranked in the top 10% most cited is substantially higher than other regions, being several fold higher than that of the USA and EU-15. China also continues to compete effectively in the Life Sciences.
Even in disciplines where China has a lower volume of research output, it is evident that its contribution to the top 10% highly cited papers is comparable to that of other regions as a proportion of total output. For example, in Clinical, Preclinical & Health (per Fig. 6), under 14,000 of China’s papers form part of the top 10% highly cited papers, yet as a proportion of its total output in this area, China’s contribution closely aligns with other countries at 12%. 14% of Chinese research outputs in Economics and Business and 19% in Social Sciences are highly cited, compared to 9% and 8%, respectively, for the USA. In Psychiatry & Psychology, 10% of Chinese research outputs are in the top 10% of highly cited papers, closely followed by 9% for the USA.
2. China’s
rise in
research


2. How China achieved its lead position in research
In this section, we explore the drivers behind China’s growth, looking more closely at how China is building an infrastructure to support high quality research and innovation.
2.1. Investment in research
China’s ambitions to become a world leader in research can be traced back over several decades. In 1978, it announced its ‘reform and opening up’ policy, involving a wide range of economic reforms including increased investment in innovation and technology.11 Investment in research and development (R&D) has grown significantly in the region. Based on year-on-year tracking of gross domestic expenditures, China accounted for 22% (US $526 billion) of the world’s R&D expenditures in 2019, the second largest contribution behind the USA, which accounted for 27% (US $656 billion) (Fig. 7).12
Figure 7: Gross domestic expenditure on R&D 2000-19.


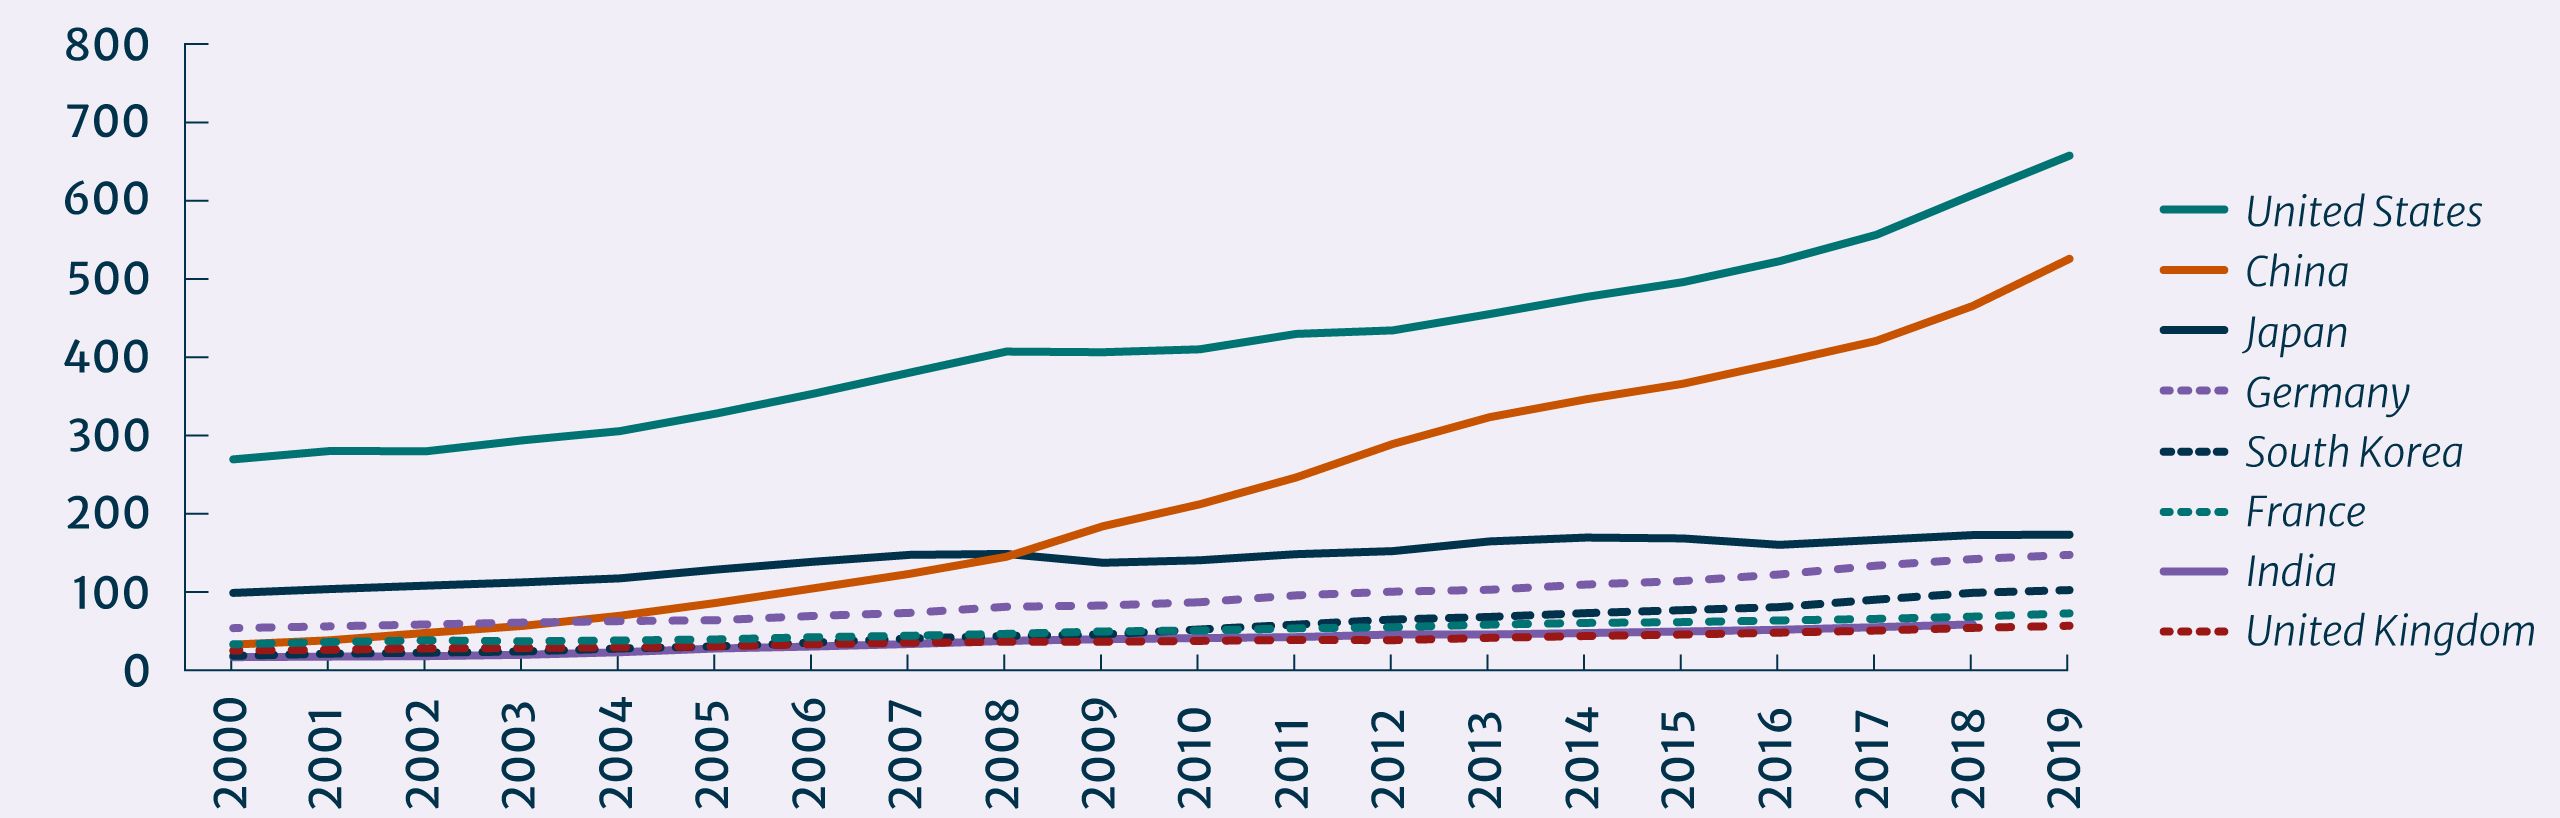
Note(s):
PPP is purchasing power parity. Data are for the top eight R&D-performing countries. Data are not available for all countries for all years. Gross domestic expenditures on R&D were revised from those reported in previous years of Science and Engineering Indicators. These data revisions were mostly due to 2020 revisions of the PPP estimates. See sidebar Revisions to Global Research and Development for more details.
Source(s):
NCSES, National Patterns of R&D Resources; OECD, MSTI March 2021 release; UNESCO, UIS, R&D dataset.
Indicators 2022: R&D
Breakdown of chart data
The 2023 Global Innovation Index (GII) also reported the rapid ascent of China’s investment in R&D, with China one of the five economies that spent the most on R&D.13 China is now ranked as 12th for innovation in the world, the only middle-income economy among the top 30 countries.
China is now ranked as 12th for innovation in the world, the only middle-income economy among the top 30 countries.
The GII also ranks the top countries for innovative capacity, identifying local concentrations of world-leading science and technology activity. From this analysis, it is clear that China has invested in developing science and technology clusters, seen as critical components to innovation by bringing together science, business, and entrepreneurs into a holistic ecosystem. The GII found China has the greatest number of science and technology clusters – 24 cities, ahead of 21 in the USA (Table 1).
Table 1: World Intellectual Property Organization (WIPO) Top 15 Global GII science and technology clusters.
|
Rank |
Cluster Name |
|---|---|
|
1 |
Tokyo–Yokohama |
|
2 |
Shenzhen–Hong Kong–Guangzhou |
|
3 |
Seoul |
|
4 |
Beijing |
|
5 |
Shanghai–Suzhou |
|
6 |
San Jose–San Francisco, CA |
|
7 |
Osaka–Kobe–Kyoto |
|
8 |
Boston–Cambridge, MA |
|
9 |
San Diego, CA |
|
10 |
New York City, NY |
|
11 |
Nanjing |
|
12 |
Paris |
|
13 |
Wuhan |
|
14 |
Hangzhou |
|
15 |
Nagoya |
2.2. Introduction of policy reforms to drive up the quality of research
China’s commitment to becoming a world leader in science can also be seen in the shift in emphasis away from volume towards quality of outputs. More than 30 policies relating to research integrity have been introduced since 2018,14 including two significant ministerial guidelines issued in 2020 to promote a healthier research and assessment culture.15
More than 30 policies relating to research integrity have been introduced since 2018.
The goal of such guidelines is to actively promote high standards of ethical behaviour in research. They shift the focus of assessment and incentives from the quantity of publications, or the impact factor of journals, towards the quality and real-world impact of scientific achievements. There has also been an increase in the public disclosure of misconduct cases to deter unethical behaviours among researchers.16 The guidelines published in 2020 also introduced an Early Warning Journal List, marking specific publications as untrustworthy, which has recently been updated.17 A further initiative announced by the Chinese government in November 2023 called for a nationwide review of research misconduct, requiring all universities to declare retractions from English and Chinese-language journals and report on why they were retracted. Together, these policies have provided an overarching architecture for governing and promoting research integrity in China and show an ongoing commitment to fostering an environment of ethical and impactful scientific research.18
2.3. Collaboration with and training in the West
There is an increasing number of students returning to China having studied internationally, helping to align the standards adopted in China with those of leading research institutions worldwide. Since 1978, over 5.2 million Chinese have studied abroad.19 Between 2003 and 2018, 26,000 students trained in Western countries returned to China under its international doctoral program.
Geopolitical relations between China and the USA have in recent years impacted previous levels of collaboration.20 However, Clarivate’s 2023 report found that despite a downturn in collaborations, the USA remains China’s most important international research partner, co-authoring over 40% of China’s collaborative output over the last decade.21 Meanwhile, China has begun to establish partnerships with countries outside of the West, including in the Middle East and Asia, particularly Singapore.22
2.4. Strength of innovation ecosystem
China's 14th five-year plan for 2021-2025 emphasises its goals for technological innovation, describing plans for lunar exploration, supercomputing, quantum information, and more. As part of its longer term vision for the years up to 2035, there are plans to establish national laboratories for fields including network communications, energy, pharmaceuticals, biotechnology, and artificial intelligence.23 As noted in section 2.1, China’s focus on building an infrastructure for innovation is also evident in the volume of science and technology clusters and investment in R&D. This investment is increasingly evident in the innovative nature of Chinese research. A 2023 study found that there were high levels of innovation in papers from China, a large proportion of which included cross-disciplinary research,24 an approach recognised as helping to foster new perspectives.25
A 2023 study found that there were high levels of innovation in papers from China.
Patents can be recognised as a further indicator of innovation. Statistics from the World Intellectual Property Organization (WIPO) show that in 2022 the highest numbers of patents in force were recorded in China (3.6 million), the USA (3.3 million) and Japan (2 million).26 China’s patent filings have been rising steadily since 2000, with analysts suggesting that it is now global leader or level with the USA.27
3. Navigating
the Chinese
research
landscape


In this section, editors can find tools to help familiarise themselves with where the best research is being undertaken as well as dive deeper to find potential experts for peer review.
3.1. World-leading institutions
3.1.1. Top university rankings
The Nature Index provides an international ranking of the leading research articles published in high-quality natural science and health journals, based on a list of journals chosen by a panel of independent researchers. In the most recent annual tables, half of the top 20 institutions were based in China.28 Each of those Chinese institutions saw improvements in their adjusted share between 2021 and 2022, while every non-Chinese institution saw a decline. In the annual tables for 2023, 7 of the top 10 institutions were based in China (Table 2).
Table 2: Nature Index university rankings: institutional table 2023.
|
Position |
Institution |
Count |
Share |
|---|---|---|---|
|
1 |
2284.28 |
||
|
2 |
1115.63 |
||
|
3 |
653.75 |
||
|
4 |
645.17 |
||
|
5 |
644.77 |
||
|
6 |
622.44 |
||
|
7 |
619.61 |
||
|
8 |
614.46 |
||
|
9 |
603.55 |
||
|
10 |
592.43 |
The Shanghai Ranking Index is another database that facilitates comparison of world university ranking. It compares the top 1,000 research universities worldwide, with four Chinese institutions in the top 50. The Index also produces a Chinese university ranking, providing a deeper look at the performance of 594 institutions across China, including research output alongside other factors such as teaching quality and facilities (Fig. 11).
Table 3: Shanghai Ranking Index: Top ten Chinese universities 2024.
|
Rank |
Institution |
Region |
Score |
|---|---|---|---|
|
1 |
Tsinghua University |
Beijing |
992.6 |
|
2 |
Peking University |
Beijing |
898.6 |
|
3 |
Zhejiang University |
Zhejiang |
793.8 |
|
4 |
Shanghai Jiao Tong University |
Shanghai |
776.3 |
|
5 |
Fudan University |
Shanghai |
697.0 |
|
6 |
Nanjing University |
Jiangsu |
656.1 |
|
7 |
University of Science and Technology of China |
Anhui |
578.4 |
|
8 |
Huazhong University of Science and Technology |
Hubei |
578.0 |
|
9 |
Wuhan University |
Hubei |
577.3 |
|
10 |
Xi'an Jiaotong University |
Shaanxi |
566.4 |
View the China university rankings
3.1.2. C9 universities
The C9 is an alliance of elite universities in China. The equivalent to the USA’s Ivy League, these institutions have consistently generated more than 20% of the nation’s output of journal articles indexed by Thomson Reuters and produced 30% of the total citations from published research.29 All nine universities rank in the top 13 in China, including seven at the top of the 2023 Shanghai Ranking Index. Despite criticisms of university ranking systems, they are noted to have provided Chinese leadership with key benchmarks for their vision to achieve world-class status.30It is clear that these institutions are not only on a par with Western institutions but in some cases have even outpaced them, based on rankings.

Fudan University
Shanghai
Shanghai Jiao Tong University
Shanghai

Harbin Institute of Technology
Harbin, Heilongjiang
Nanjing University
Nanjing, Jiangsu
Peking University
Beijing
Tsinghua University
Beijing
University of Science and Technology of China
Hefei, Anhui
Xi'an Jiaotong University
Xi'an, Shaanxi

Zhejiang University
Hangzhou, Zhejiang
Further reading

University of Science and Technology of China (USTC): “exceptional achievements in research and education”
Over four decades, the university has fostered hundreds of successful scientists, researchers, and entrepreneurs, building strategic relationships with leading international research universities and institutes.
Read more from THE rankings
Chinese Academy of Sciences (CAS): “almost double the share of Harvard University, accounting for 2.8% of Nature Index”
CAS comprises a comprehensive research network with 110+ research institutes, a traditional merit-based academic society, and a system of higher education. Home to approximately 56,000 professional researchers, 22,800 are research professors or associate professors. CAS attaches much importance to international cooperation and has extensive and diversified partnerships with scientists all over the world. In the 2023 Nature Index, CAS was the fastest rising institution for output, with a 184-point rise in adjusted share from 2021–2022.
Read more from Nature Index

Southern University of Science and Technology (SUSTech): “aims for high-calibre young scientists by offering internationally competitive tenure-track packages and state-of-the-art facilities”
SUSTech in Shenzhen was the fastest-growing young university in Nature Index in 2019. Established just 13 years ago, it has already risen to 24th in the world, thanks to rapid investment, international collaboration, and a heavy focus on attracting the best research talent.
Read more from Nature Index
3.2. World-leading researchers
3.2.1. Highly Cited Researchers
Clarivate’s 2023 report lists researchers who have demonstrated significant and broad influence in their fields. Mainland China has the second highest number of Highly Cited Researchers after the USA and has more than doubled its share of Highly Cited Researchers since 2018. Read more from Clarivate
Further reading
Yunlong Cao
Nature’s Ten people who helped shape science’ in 2022 features Yunlong ‘Richard’ Cao’s team and his COVID-19 predictor. Cao developed a high-throughput method which shows, in fine detail, how the virus could respond to antibody pressure. By characterising antibodies in detail, his team has successfully predicted many of the mutations that define emerging SARS-CoV-2 variants, helping researchers stay ahead of the virus
Read more from Nature
4. Authors
Ritu Dhand
Chief Scientific Officer
Springer Nature
Aman Ganpatsingh
Senior Marketing Manager
Springer Nature
Amy Lin
Head of Strategy & Market Intelligence
Springer Nature
Mithu Lucraft
Senior Consultant
TBI Communications
How to cite the report
Springer Nature (2024, August). Global Research Pulse: China Report

References
(Links open in a new window)
1 Clarivate (October 2023). ISI Global Research Report: China’s research landscape. https://clarivate.com/lp/Chinas-research-landscape/.
2 NSF (2018). The rise of China in science and engineering. National Science Foundation: Science and Engineering Indicators. https://www.nsf.gov/nsb/sei/one-pagers/China-2018.pdf
3 Matsuzoe, R. (2022). China tops U.S. in quantity and quality of scientific papers. Nikkei Asia. https://asia.nikkei.com/Business/Science/China-tops-U.S.-in-quantity-and-quality-of-scientific-papers
4 Clarivate (October 2023). ISI Global Research Report: China’s research landscape. https://clarivate.com/lp/Chinas-research-landscape/.
5 EU-15 countries: Austria, Belgium, Denmark, Finland, France, Germany, Greece, Ireland, Italy, Luxembourg, Netherlands, Portugal, Spain, Sweden, and the United Kingdom
6 Matsuzoe, R. (2022). China tops U.S. in quantity and quality of scientific papers. Nikkei Asia. https://asia.nikkei.com/Business/Science/China-tops-U.S.-in-quantity-and-quality-of-scientific-papers
7 Clarivate (October 2023). ISI Global Research Report: China’s research landscape. https://clarivate.com/lp/Chinas-research-landscape/
8 Op. cit.
9 Data sources: Clarivate InCites where we looked at articles and reviews from 2021 (dataset updated 25 August 2023), country based on corresponding author affiliation
10Clarivate (2022). Journal Citation Reports: Quartile rankings and other metrics. https://support.clarivate.com/ScientificandAcademicResearch/s/article/Journal-Citation-Reports-Quartile-rankings-and-other-metrics?language=en_US
11 Lu, Y. et al. (2019). Forty years of reform and opening up: China’s progress toward a sustainable path. Science Advances 5. https://doi.org/10.1126/sciadv.aau9413
12 NSF (2022). The State of U.S. Science and Engineering 2022. U.S. and Global Research and Development. National Science Foundation. https://ncses.nsf.gov/pubs/nsb20221/u-s-and-global-research-and-development
13 WIPO (20 September 2023). GII Science and Technology Clusters: Tokyo-Yokohama tops ranking; China now home to greatest number. https://www.wipo.int/pressroom/en/articles/2023/article_0009.html
14 Yang, Y. et al. (2022). Progress and challenges of research integrity in China. Cultures of Science 5, 173-177. https://doi.org/10.1177/20966083221143545
15 Chinese Ministry of education, Ministry of Science and Technology: Guidelines on Standardizing the Use of SCI Paper-related Indicators in Institutions of High education, and Establishing Correct Evaluation Guidance; Ministry of Science and Technology: Measures to Eliminate the Adverse Effects of the 'Paper-Only' Orientation in Scientific Evaluation (Trial)
16 Yang, Y. et al. (2022). Progress and challenges of research integrity in China. Cultures of Science 5, 173-177. https://doi.org/10.1177/20966083221143545
17Mallapaty, S. (2024). China has a list of suspect journals and it’s just been updated. Nature (6 March 2024). https://www.nature.com/articles/d41586-024-00629-0
18 Mallapaty, S. (2024). China conducts first nationwide review of retractions and research misconduct. Nature (12 February 2024). https://www.nature.com/articles/d41586-024-00397-x
19 Xinhua (30 March 2018). More Chinese students study abroad. http://www.xinhuanet.com/english/2018-03/30/c_137077465.htm
20 Hua, S. & Hao, K. (2022). U.S.-China tensions fuel outflow of Chinese scientists from U.S. universities. Wall Street Journal (22 September 2022). https://www.wsj.com/articles/u-s-china-tensions-fuel-outflow-of-chinese-scientists-from-u-s-universities-11663866938
21 Clarivate (2023). Clarivate report reveals China challenging U.S research dominance, signaling future research ambitions. (31 October 2023). https://clarivate.com/news/clarivate-report-reveals-china-challenging-u-s-research-dominance-signaling-future-research-ambitions/
22 Nature Index (9 August 2023). Mapping China’s shifting research collaboration. https://www.nature.com/articles/d41586-023-02161-z
23 Woolston C. (2023). What China’s leading position in natural sciences means for global research. Nature Index (9 August 2023). https://www.nature.com/articles/d41586-023-02159-7
24 Wagner, C. (2023). China now publishes more high-quality science than any other nation – should the US be worried? The Conversation (10 January 2023). https://theconversation.com/china-now-publishes-more-high-quality-science-than-any-other-nation-should-the-us-be-worried-192080
25 Cao, C. (2023). China must draw on internal research strength. Nature Index (8 November 2023). https://www.nature.com/articles/d41586-023-03445-0
26 WIPO (2022). WIPO IP Facts and Figures 2022. https://www.wipo.int/edocs/pubdocs/en/wipo-pub-943-2022-en-wipo-ip-facts-and-figures-2022.pdf
27 Kersten, A., Athanasia, G., Arcuri, G. (2022). What can patent data reveal about U.S.-China technology competition? (19 September 2022). CSIS https://www.csis.org/analysis/what-can-patent-data-reveal-about-us-china-technology-competition
28 Woolston, C. (2023). Annual Tables 2023: China tops natural-science table. Nature Index (15 June 2023). https://www.nature.com/articles/d41586-023-01868-3
29 Times Higher Education (February 17 2011). Eastern stars: Universities of China's C9 League excel in select fields. https://www.timeshighereducation.com/news/eastern-stars-universities-of-chinas-c9-league-excel-in-select-fields/415193.article
30 Allen, R. (2017). A comparison of China’s “Ivy League” to other peer groupings through global university rankings. Journal of Studies in International Education, 21(5). https://journals.sagepub.com/doi/10.1177/1028315317697539