Perceptions of fairness and bias in the scholarly publishing ecosystem:
a global survey

Foreword


Ritu Dhand
Chief Scientific Officer
Springer Nature
Sowmya Swaminathan
Director, Global Inclusion, Research
Springer Nature

Springer Nature works with thousands of editors and reviewers across our journals and books to ensure that every author benefits from a fair, constructive editorial assessment and an independent peer review process. As an independent mediator of the peer review process, we believe we have a crucial role in safeguarding fairness. Our commitment to identifying and reducing bias is grounded in maintaining an impartial publishing process where decisions are driven by research quality. Upholding this principle is not only critical to the strength of the research we publish, but also to maintaining the trust of our authors and readers. Yet bias, whether conscious or unconscious, remains a widely felt and often under-discussed concern within the research community, prompting us to explore the issue more deeply.
This report presents findings from a global survey that captures how researchers perceive and experience bias across the scholarly publishing landscape. The global research landscape has diversified dramatically in the past decade. Researchers from emerging regions now represent an ever-greater share of research output, yet benchmarking shows that some of the most active countries producing research – especially China and India – remain underrepresented among academic external editors who are usually also practicing researchers in universities, members of editorial boards, and peer reviewers. This disparity risks reinforcing country-related bias in publishing outcomes.
These disparities are not unique to any single publisher, and for that reason, this research engaged a broad international community of researchers. The fact that more than 11,000 researchers responded is an indication of the strength of feeling on this topic. The findings are clear: most researchers believe there is bias in the publishing process, and that this is especially strongly felt in relation to the region and location of the researcher(s), followed by institutional affiliation and network bias. Experience or perceptions of bias affect researchers’ trust and their decisions about where to publish. Encouragingly, researchers also believe that publishers have both the responsibility and the means to act.
At Springer Nature, we are committed to supporting our editors and reviewers in recognising and reducing bias, to ensure a fair peer review process. Since 2024, we have offered implicit bias training for journal and book editors, raising awareness of where bias may occur and offering practical steps to address it. These efforts form part of our wider work to strengthen global inclusion in research publishing (see Global Inclusion in Research Publishing). We hope these findings stimulate discussion, reflection and collective action to broaden participation and create greater inclusion and fairness in research publishing.

Executive summary
This report presents findings from a global survey conducted by Springer Nature to understand how researchers perceive bias in the publishing process across the scholarly publishing landscape as a whole. Editors and peer reviewers assess research and make publication decisions every day and awareness of potential unconscious or conscious biases can help publishers and others in the scholarly ecosystem to provide guidance and processes to ensure fair decision making.
The survey received 11,866 responses, of which 8,485 were analysed across career stages, disciplines, and regions (see Methodology).1 Questions and responses reflect perceptions and engagement across the scholarly publishing landscape and do not differentiate between different journals or publishers.
Key findings

Perceptions of bias are widespread and country-related bias is the most commonly perceived.
- 91% of survey participants think there is some degree of bias in academic publishing. 37% percieve that bias to be very or extremely prevalent; and 34% describe it as moderately prevalent.
- Country-related bias (62%) was the most commonly perceived bias, followed by institutional affiliation bias (56%) and professional network bias (55%).
- On average, 47% believe that there is a bias in the Global North against researchers from the Global South. This is felt most in Latin America & Caribbean (76%)2, Sub-Saharan Africa (50%) and East Asia & Pacific (50%).
- 44% feel their institution is perceived as less prestigious because of its location.

Considering the scholarly publishing landscape as A whole, 71% of researchers identify bias as primarily occurring in the initial editorial assessment and decision.
- Researchers identified the initial editorial assessment and decision about whether to send a manuscriptout for peer review (71%) and the peer review process itself (64%), as stages where bias primarily occurs.
- 79% attributed bias to relationships between researchers and editors or reviewers.
- Nearly half (47%) believe bias occurs mostly or exclusively in article publishing whereas 28% believe it occurs in both article and book publishing.

Most researchers say that they have personally experienced bias.
- 84% say they have experienced bias in some way. The most common experiences include rejections followed by similar papers being published (42%), lack of appreciation for regional relevance (29%), and reviewer focus on language rather than scientific merit (25%).
- Researchers in Latin America & Caribbean (44%), Sub-Saharan Africa (40%), and East Asia & Pacific (34%) report the highest instances of bias due to what they believe to be a lack of recognition for regional research.

Perceptions of bias shape publishing behaviour.
- 72% consider the possibility of bias when deciding where to submit a paper. 45% said it significantly influences their decision about where to publish, and this is even higher among high-volume authors (57%)3 and researchers from China (58%), Brazil (50%), and India (45%).
- 30% of researchers who have (or believe they have) experienced bias will not submit to a journal again after the experience.
- 3 in 4 researchers engage in strategies to potentially decrease bias, such as collaborating with international co-authors or utilising a language service, particularly in China and Brazil.

Researchers expect publishers to have solutions to mitigate and prevent bias.
- 91% expect publishers to have clear policies and systems to address bias.
- Areas to address with editors include training to recognise and minimise bias (62%), transparency of editorial decision making (53%), and prioritisation of scientific content over language (52%).
- Areas to address with reviewers include guidelines on how to minimise bias (56%), transparent or double anonymised review (53%), and training on how to deliver bias-free feedback (51%).
- Respondents also highlighted the need for language tools (59%), accessible guidelines in multiple languages (39%), and information on author diversity (36%).

These survey data underscore the need for publishers to proactively work on reducing bias, strengthening author trust, and ensuring that all research is assessed on its merit. The report discusses ways that Springer Nature is working to improve fairness and inclusion in scholarly publishing.

Introduction
Bias, whether explicit or implicit, can affect how editors and peer reviewers assess manuscripts. Previous studies have documented persistent sources of bias within editorial selection and review processes. They reveal, for example, that editorial decisions can be influenced by institutional affiliation, author reputation, author gender, or country of origin, even before a manuscript is sent out to review. Similar biases related to nationality, facility with the English language, and institutional prestige have been shown to influence reviewer feedback.4 Understanding potential sources of bias in the publication process is a first step to ensuring fair decision making.
While recent data suggest gradual progress, the issue remains a concern. IOP Publishing’s State of Peer Review 2024, which surveyed peer reviewers in the physical sciences, found that perceptions of bias in peer review are gradually declining.5 We wanted to better understand how researchers perceive and interpret bias within regions and disciplines across the scholarly publishing landscape, and what actions publishers can take to strengthen trust.
Bias can be challenging to demonstrate empirically, so this report focuses on perceptions and personal experiences. Some accounts describe perceptions of bias, while others provide specific examples of bias observed or experienced firsthand. Perceptions of bias shape researchers’ trust, influence submission decisions, and ultimately affect the relationship between researchers and publishers, making them essential to understand and mitigate.
The survey intentionally set out to capture a wide range of perspectives, ensuring strong representation across geographic regions. Although career cohorts were split more or less evenly between senior researchers and early-to-mid career researchers, women and non-binary or gender diverse researchers were underrepresented in the survey dataset. The final sample offers a broad global view, including established regions with high levels of research output, as well as amplifying emerging regions and the Global South. This balance allows us to highlight the experiences and perceptions of bias among communities that have previously been less visible in other analyses of the publishing landscape.
Scholarly publishing relies on an ecosystem of checks and balances involving researchers, independent peer reviewers, and editors. Each plays a distinct role in ensuring integrity, rigour, and fairness. Recognizing and addressing bias is a critical part of our approach to ensuring that researchers from all backgrounds are empowered to participate in research publishing, thereby enhancing global inclusion.
Section 1: Perceptions of bias in scholarly publishing
1.1. 91% of survey participants think bias in scholarly publishing is prevalent to some degree
Figure 1: How prevalent is bias in academic publishing?
To what extent do you believe the international academic publishing process has a bias against or preference for whose research gets accepted and published? (n=8485)


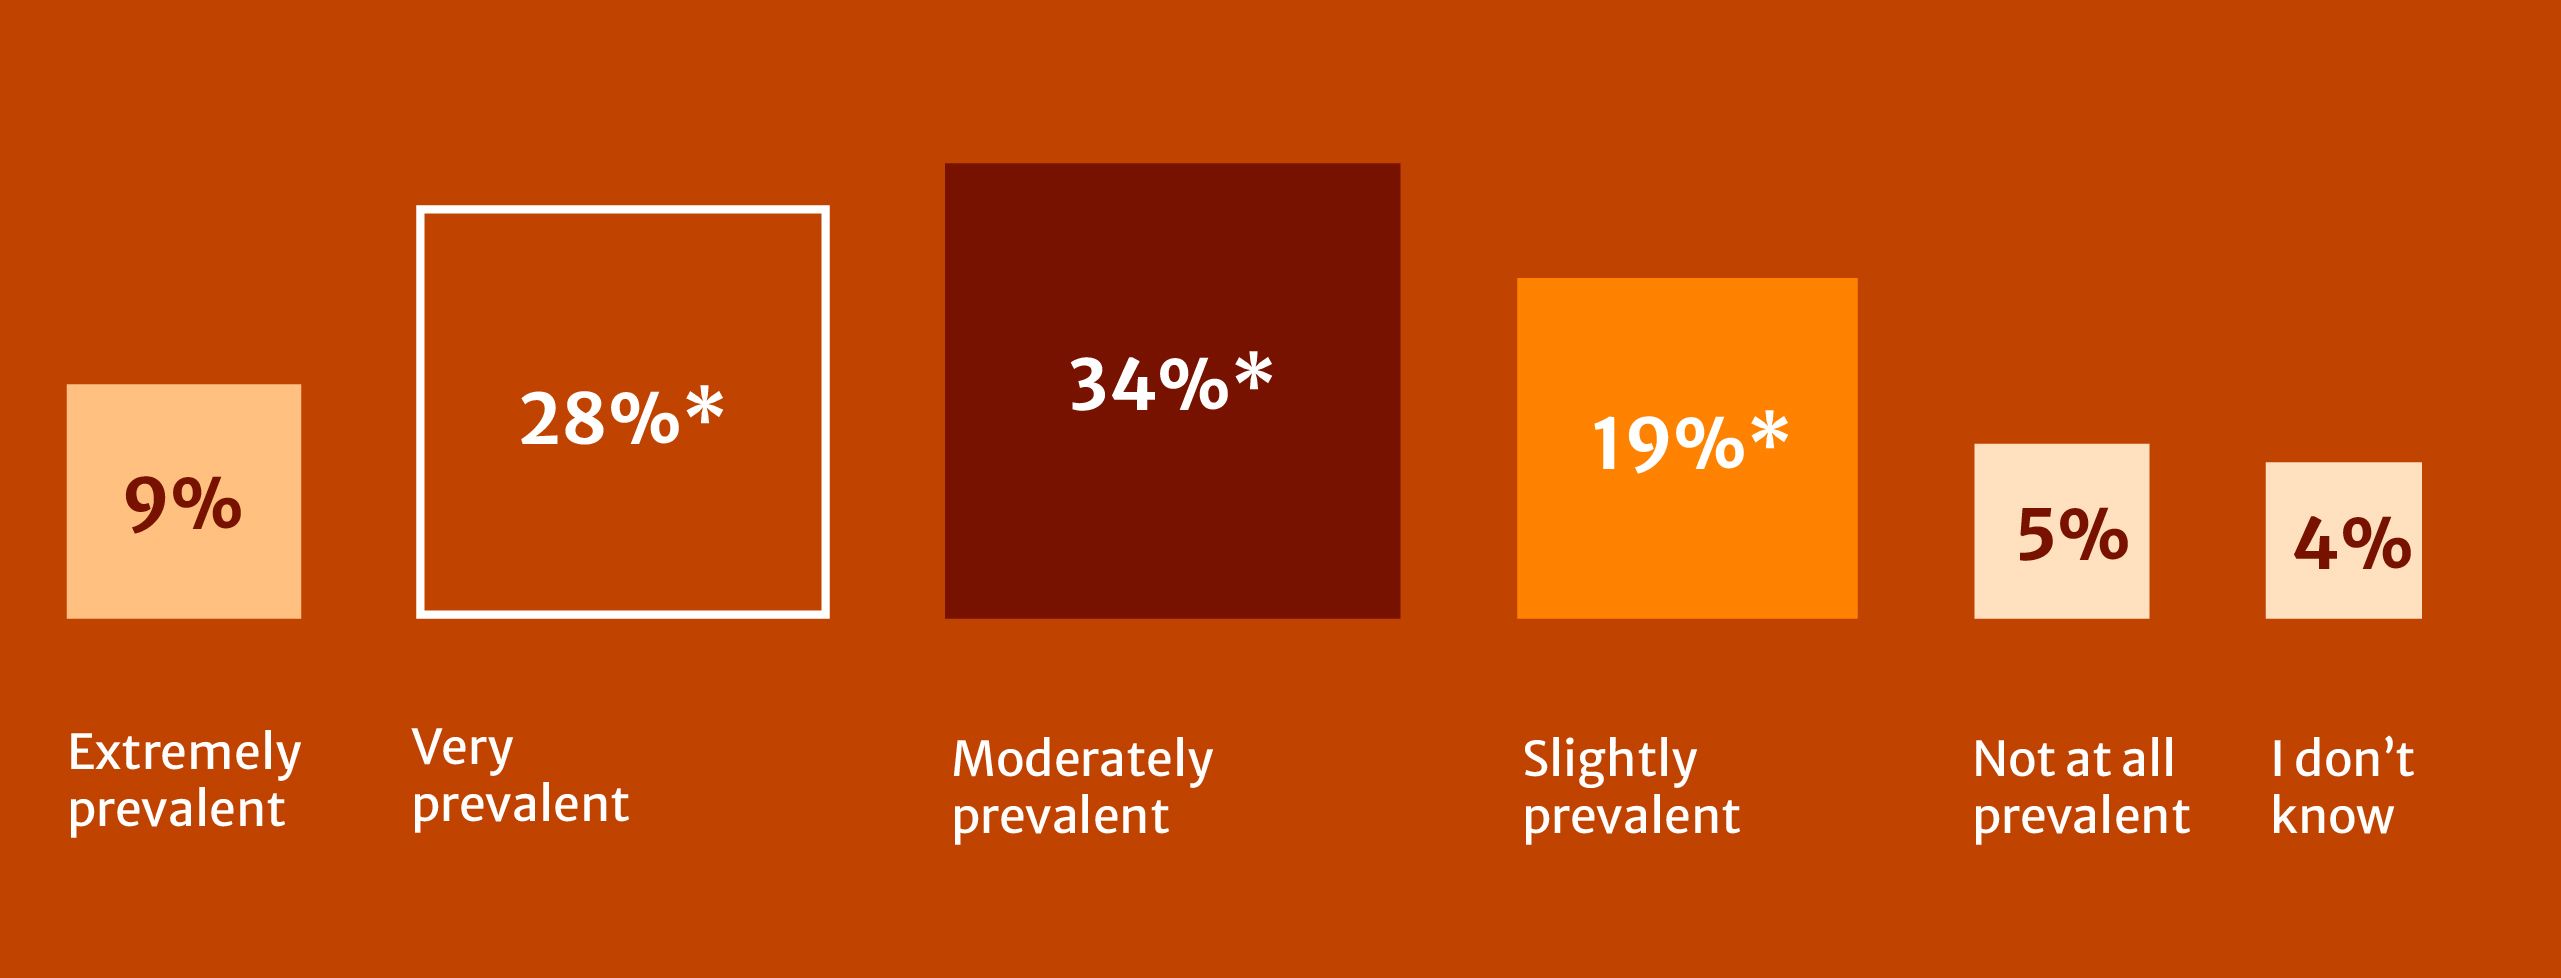
*Indicates statistically significant at a p-value of 0.001. Percentages may not total 100% due to rounding.
Table figure 1: How prevalent is bias in academic publishing?
|
% |
|
|---|---|
|
Extremely prevalent |
9% |
|
Very prevalent |
28%* |
|
Moderately prevalent |
34%* |
|
Slightly prevalent |
19%* |
|
Not at all prevalent |
5% |
|
I don’t know |
4% |
*Indicates statistically significant at a p-value of 0.001. Percentages may not total 100% due to rounding.
A clear majority of respondents report perceiving bias in academic publishing. However, the intensity of this perception varies (Fig. 1). 37% regard it as very or extremely prevalent, 34% as moderately prevalent, and 19% as only slightly prevalent.
Nearly half of respondents (47%) believe that bias occurs mostly or exclusively in article publishing, while 28% feel bias affects both article and book publishing. It is unclear, however, whether all respondents have experienced it in both formats or whether this opinion reflects a lack of experience for respondents with book publishing.
Perceptions of bias vary across researcher groups by region, gender, and publishing volume.
- Researchers in Latin America & Caribbean (48%) followed by North America (39%) and Europe & Central Asia (39%) were more likely than those in any other region to view bias as extremely or very prevalent.
- Women were more likely than men to perceive high levels of bias (42%).
- Finally, those with the highest publishing volumes (15 articles or more in two years) also reported higher perceived prevalence of bias (44%).

"Data from Africa was not considered relevant despite explicating a global phenomenon"
1.2. Country or region-related bias is the most commonly perceived bias
The most reported form of bias, regardless of personal experience, is country-related bias (62%). This was followed by institutional affiliation bias (56%) and network bias (55%) (Fig. 2).
Figure 2: Types of perceived bias
Regardless of your personal experiences, which types of bias do you believe exist in international academic publishing? (n=8445)


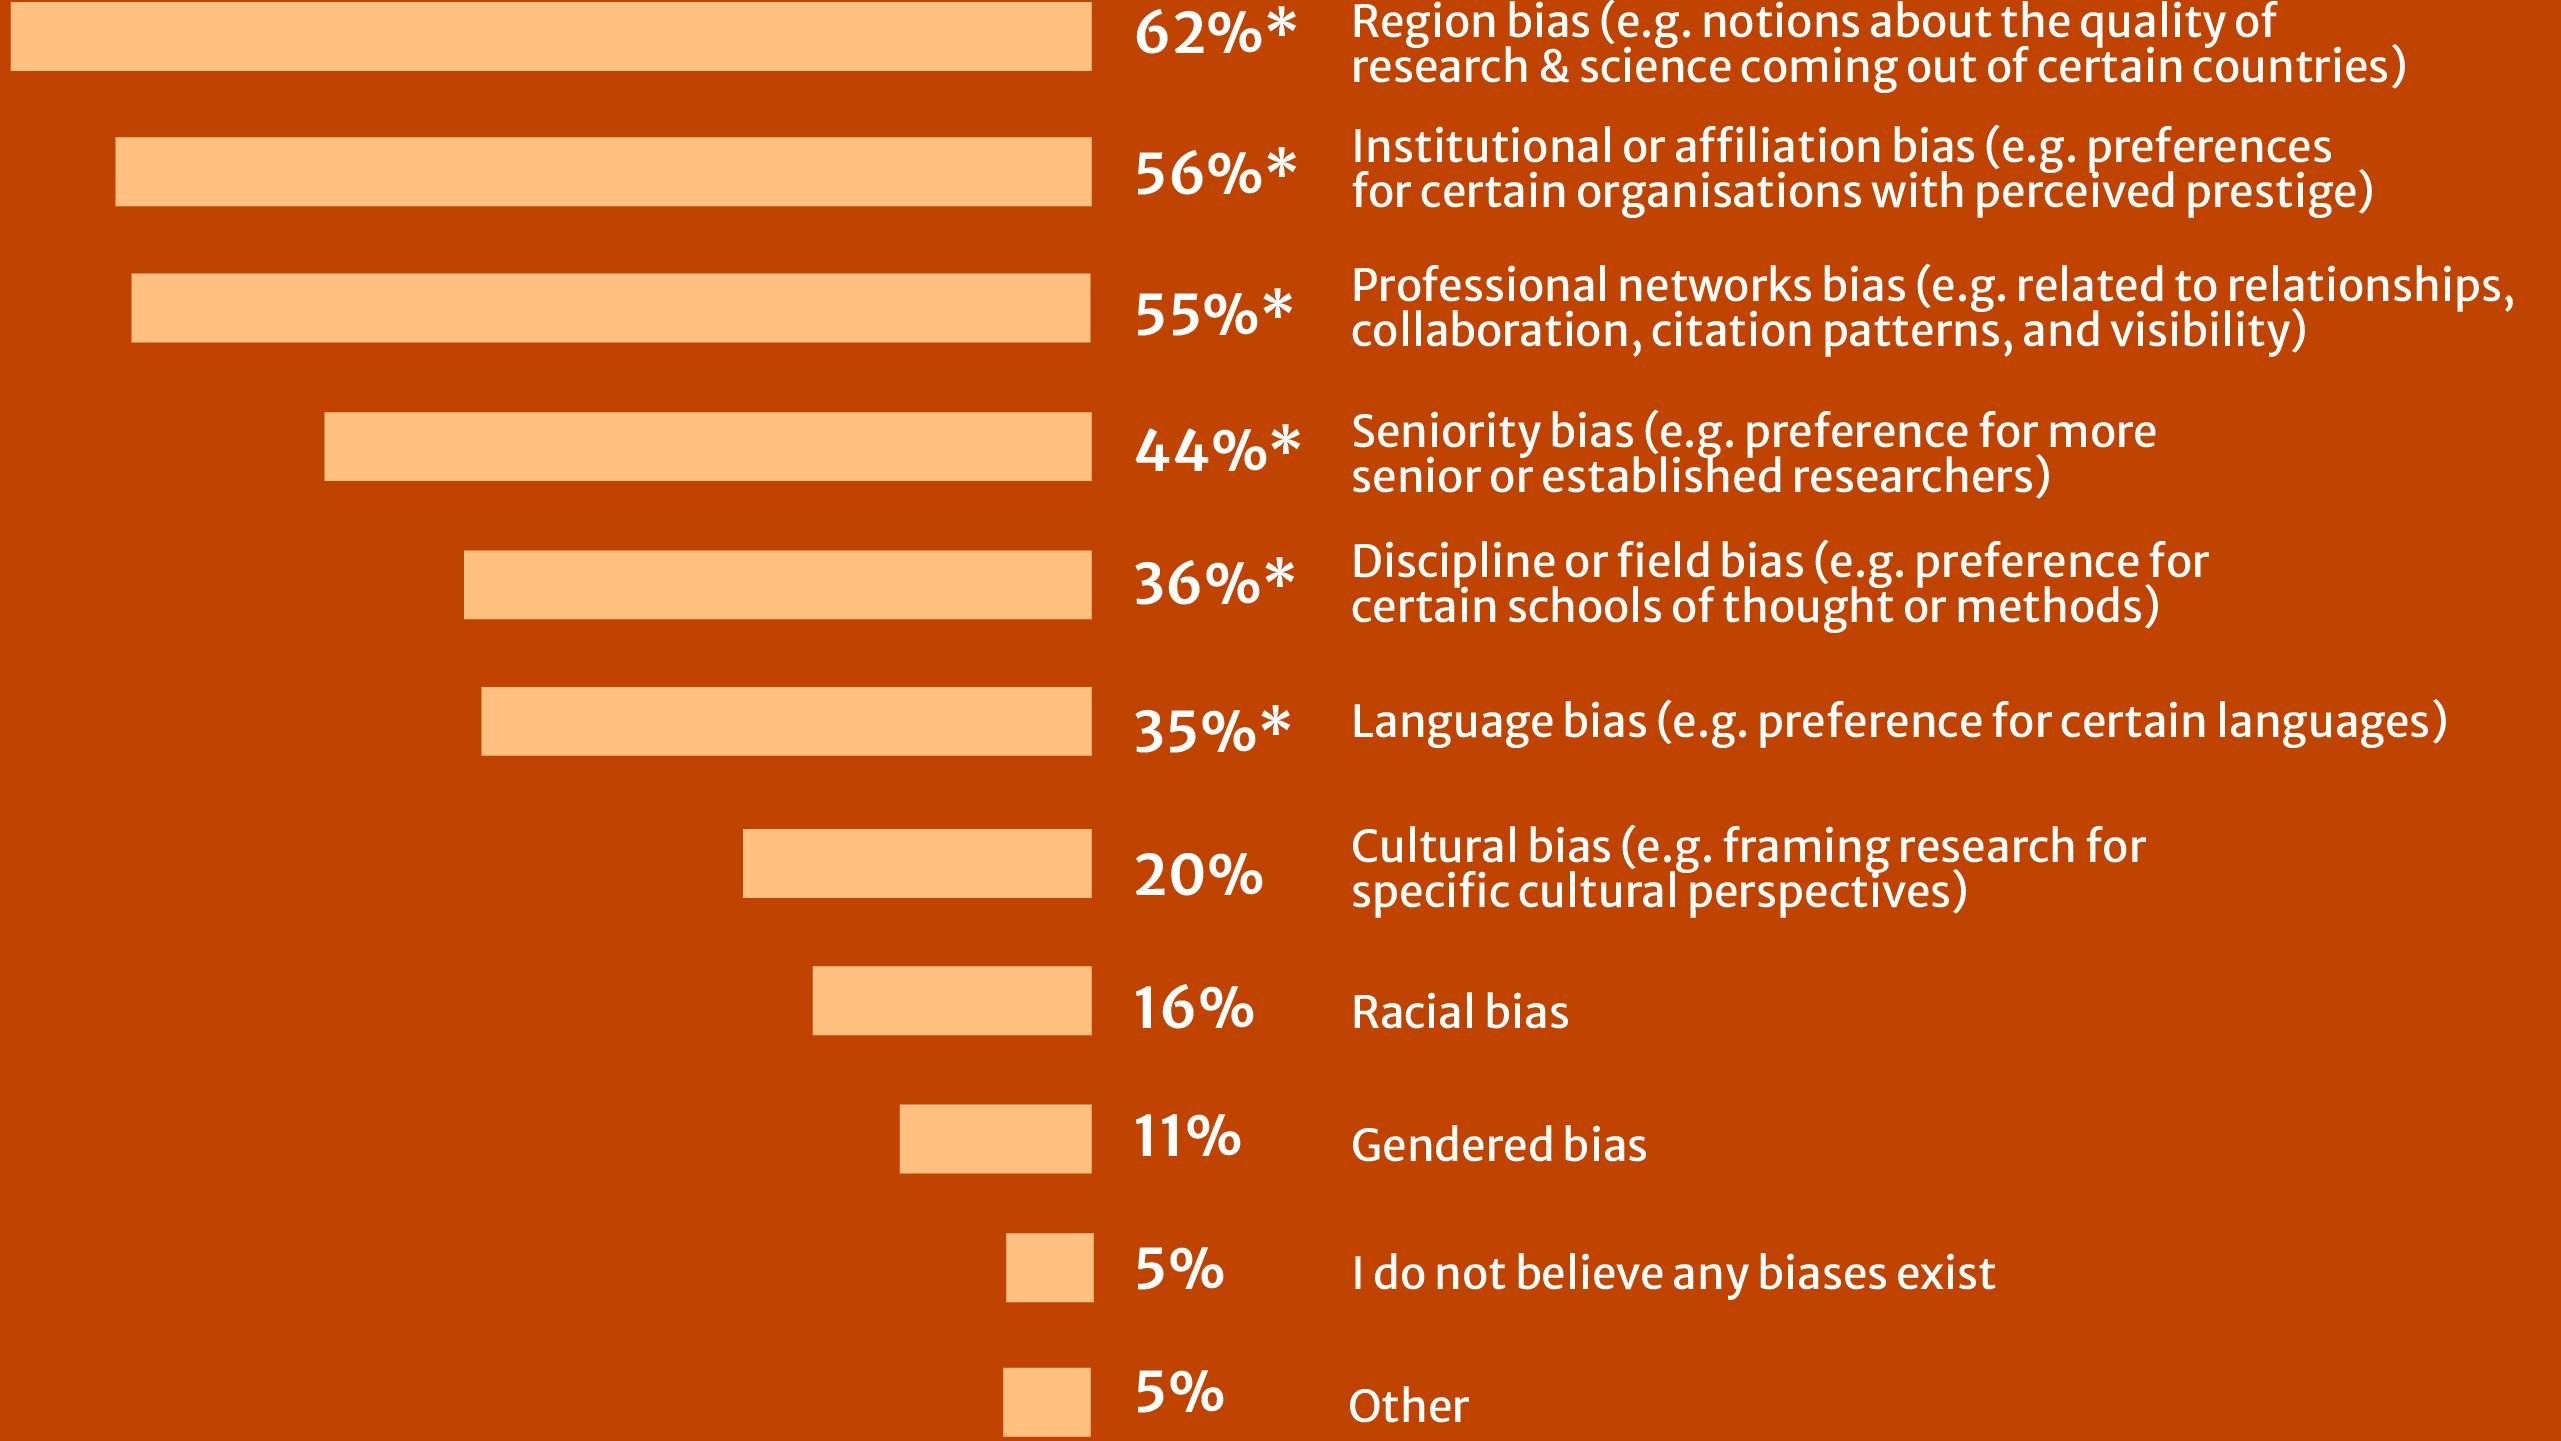
*Indicates statistically significant at a p-value of 0.001.
Table figure 2: Types of perceived bias
|
% |
|
|---|---|
|
Region bias (e.g. notions about the quality of research & science coming out of certain countries) |
62%* |
|
Institutional or affiliation bias (e.g. preferences for certain organisations with perceived prestige) |
56%* |
|
Professional networks bias (e.g. related to relationships, collaboration, citation patterns, and visibility) |
55%* |
|
Seniority bias (e.g. preference for more senior or established researchers) |
44%* |
|
Discipline or field bias (e.g. preference for certain schools of thought or methods) |
36%* |
|
Language bias (e.g. preference for certain languages) |
35%* |
|
Cultural bias (e.g. framing research for specific cultural perspectives) |
20% |
|
Racial bias |
16% |
|
Gendered bias |
11% |
|
I do not believe any biases exist |
5% |
|
Other |
5% |
*Indicates statistically significant at a p-value of 0.001.
Perceptions of country or regional bias were highest in:
Latin America & Caribbean
78%
Europe & Central Asia
66%
Middle East & North Africa
66%
Perceptions of country or region-related bias were highest in Latin America & Caribbean (78%), Europe & Central Asia (66%), and the Middle East & North Africa (66%). It was the main bias cited by respondents from China (61%) and India (56%). In contrast, institutional affiliation and network biases were more strongly cited by respondents in North America and Europe & Central Asia, ranging from 65 to 69%. Respondents from the USA cited institutional or affiliation bias (70%) and professional network bias (66%) as the main sources of bias.
Open-text comments indicate that these forms of bias often overlap. Because institutional affiliations and professional networks are closely tied to geography, they reinforce regional inequalities. Respondents also described language and name-based assumptions as further evidence of regional bias.

"Editor desk rejected an article when I submitted from an Indian institution email address (ending.in), accepted the same article with no changes,[…] when it was submitted by a colleague 2 months later with a UK institution email (.ac.uk)"
1.3. Majority of respondents indicate that bias occurs in the initial editorial assessment and decision
When asked to identify where in the publication workflow bias is most likely to appear, 71% of researchers pointed to the initial editorial assessment and decision about whether or not to send an article to peer review, while 64% perceived bias as occurring during the peer review process itself (Fig. 3).
Figure 3: Where is bias perceived as occurring in the publishing process?
At what stage(s) of the academic publishing process do you believe bias exists? (n=7902)

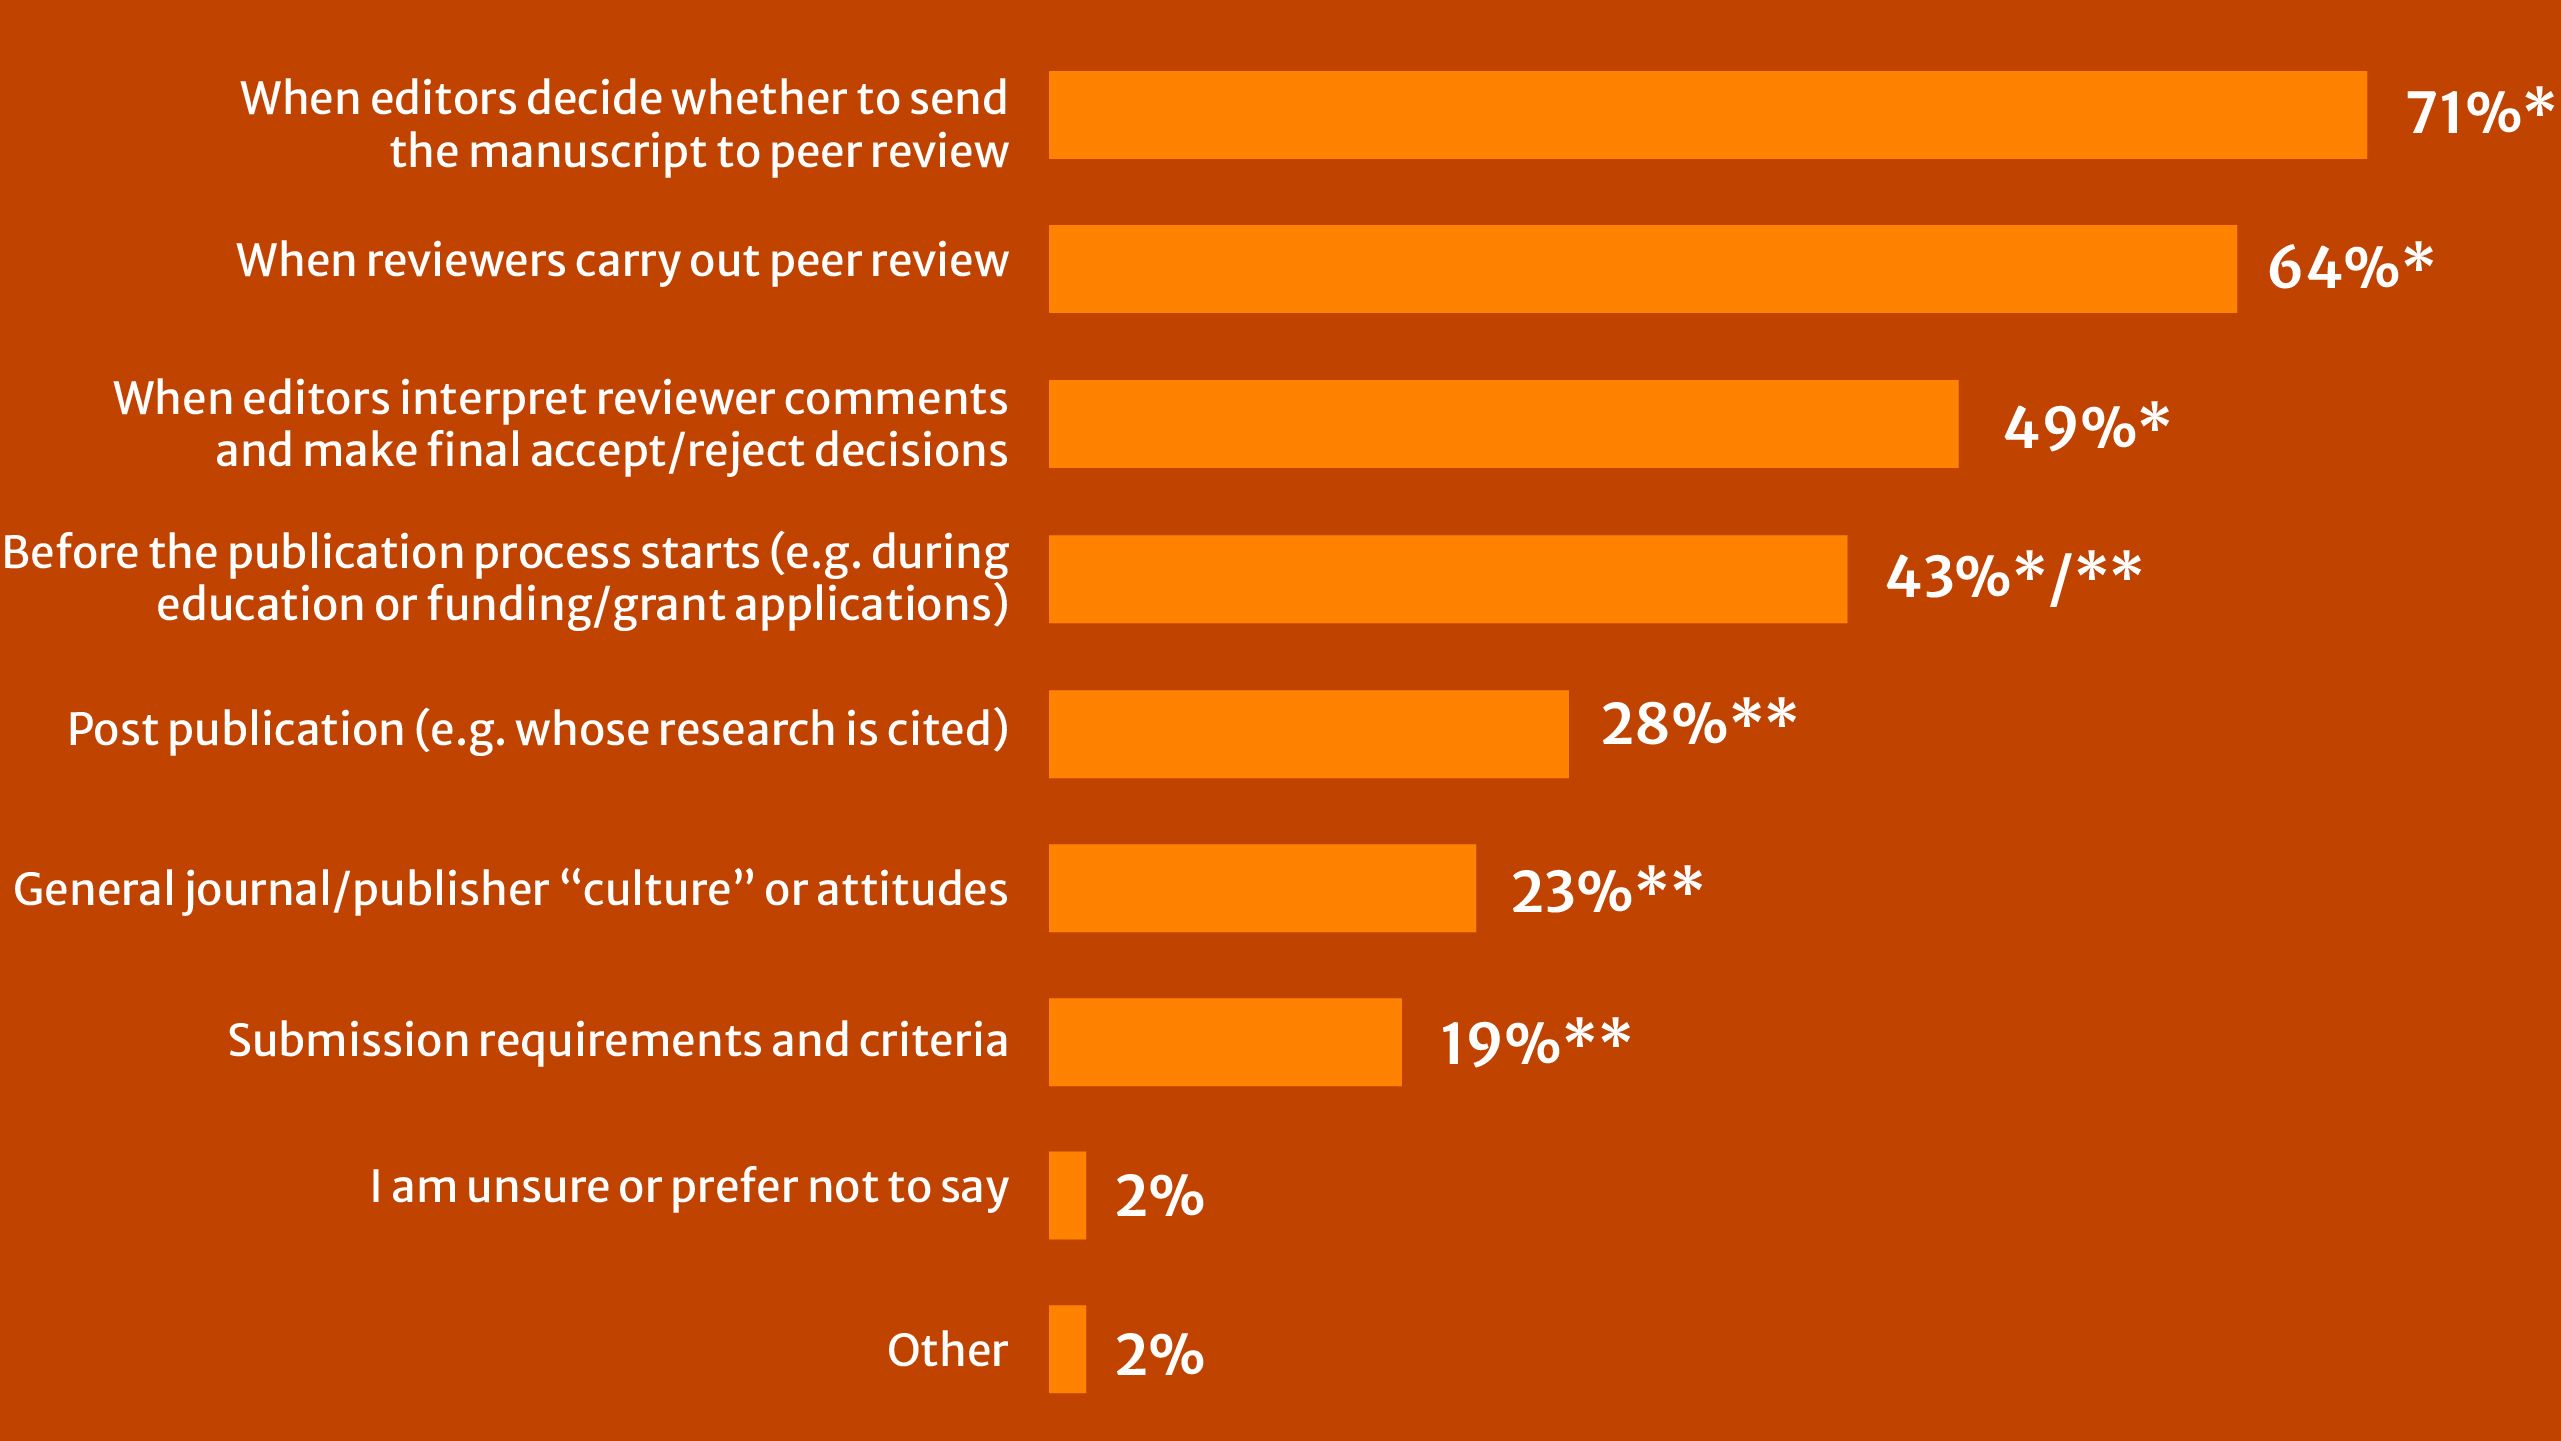
* Indicates statistically significant at a p-value of 0.001.
** Outside publisher's scope.
Table Figure 3: Where is bias perceived as occurring in the publishing process?
|
% |
||
|---|---|---|
|
When editors decide whether to send the manuscript to peer review |
71%* |
At first editorial decision to send to peer review |
|
When reviewers carry out peer review |
64%* |
|
|
When editors interpret reviewer comments and make final accept/reject decisions |
49%* |
Editorial interpretation of reviewer comments and making final decisions |
|
Before the publication process starts (e.g. during education or funding/grant applications) |
43%*/** |
Before the publication process (e.g. education or funding) |
|
Post publication (e.g. whose research is cited) |
28%** |
|
|
General journal/publisher “culture” or attitudes |
23%** |
|
|
Submission requirements and criteria |
19%** |
Significant for Early Career Researchers |
|
I am unsure or prefer not to say |
2% |
|
|
Other |
2% |
*Indicates statistically significant at a p-value of 0.001.
** Outside publisher's scope.
Researchers also highlighted professional networks and connections as major drivers of bias:


79% attributed bias to relationships between editors/reviewers and authors. This view was uniformly shared across global regions but suggested most strongly by respondents from Europe & Central Asia (85%) and least strongly by those from Sub-Saharan Africa (69%) and the Middle East & North Africa (68%).


53% agreed that it is more important to address bias among editors than among reviewers; this went up to 62% and 65% respectively for respondents from China and India, versus 37% of respondents from the USA. The perception that editors have the greatest influence over publishing outcomes was also reinforced across broad global regions, especially South Asia (66%), Middle East & North Africa (64%), Sub-Saharan Africa (62%), and East Asia & Pacific (57%).


44% feel their institution is perceived as less prestigious because of its country of location, compounding perceived institutional affiliation and network biases. Of the three largest global producers of research output, this perception was particularly strong within India (50%) and China (47%) relative to the USA (16%). The highest perceptions across global regions include Latin America & Caribbean (68%), Middle East & North Africa (62%), Sub-Saharan Africa (53%) and South Asia (52%).

Section 2: Experience of bias
2.1. Majority of researchers surveyed report having had personal experience of bias during the publishing process
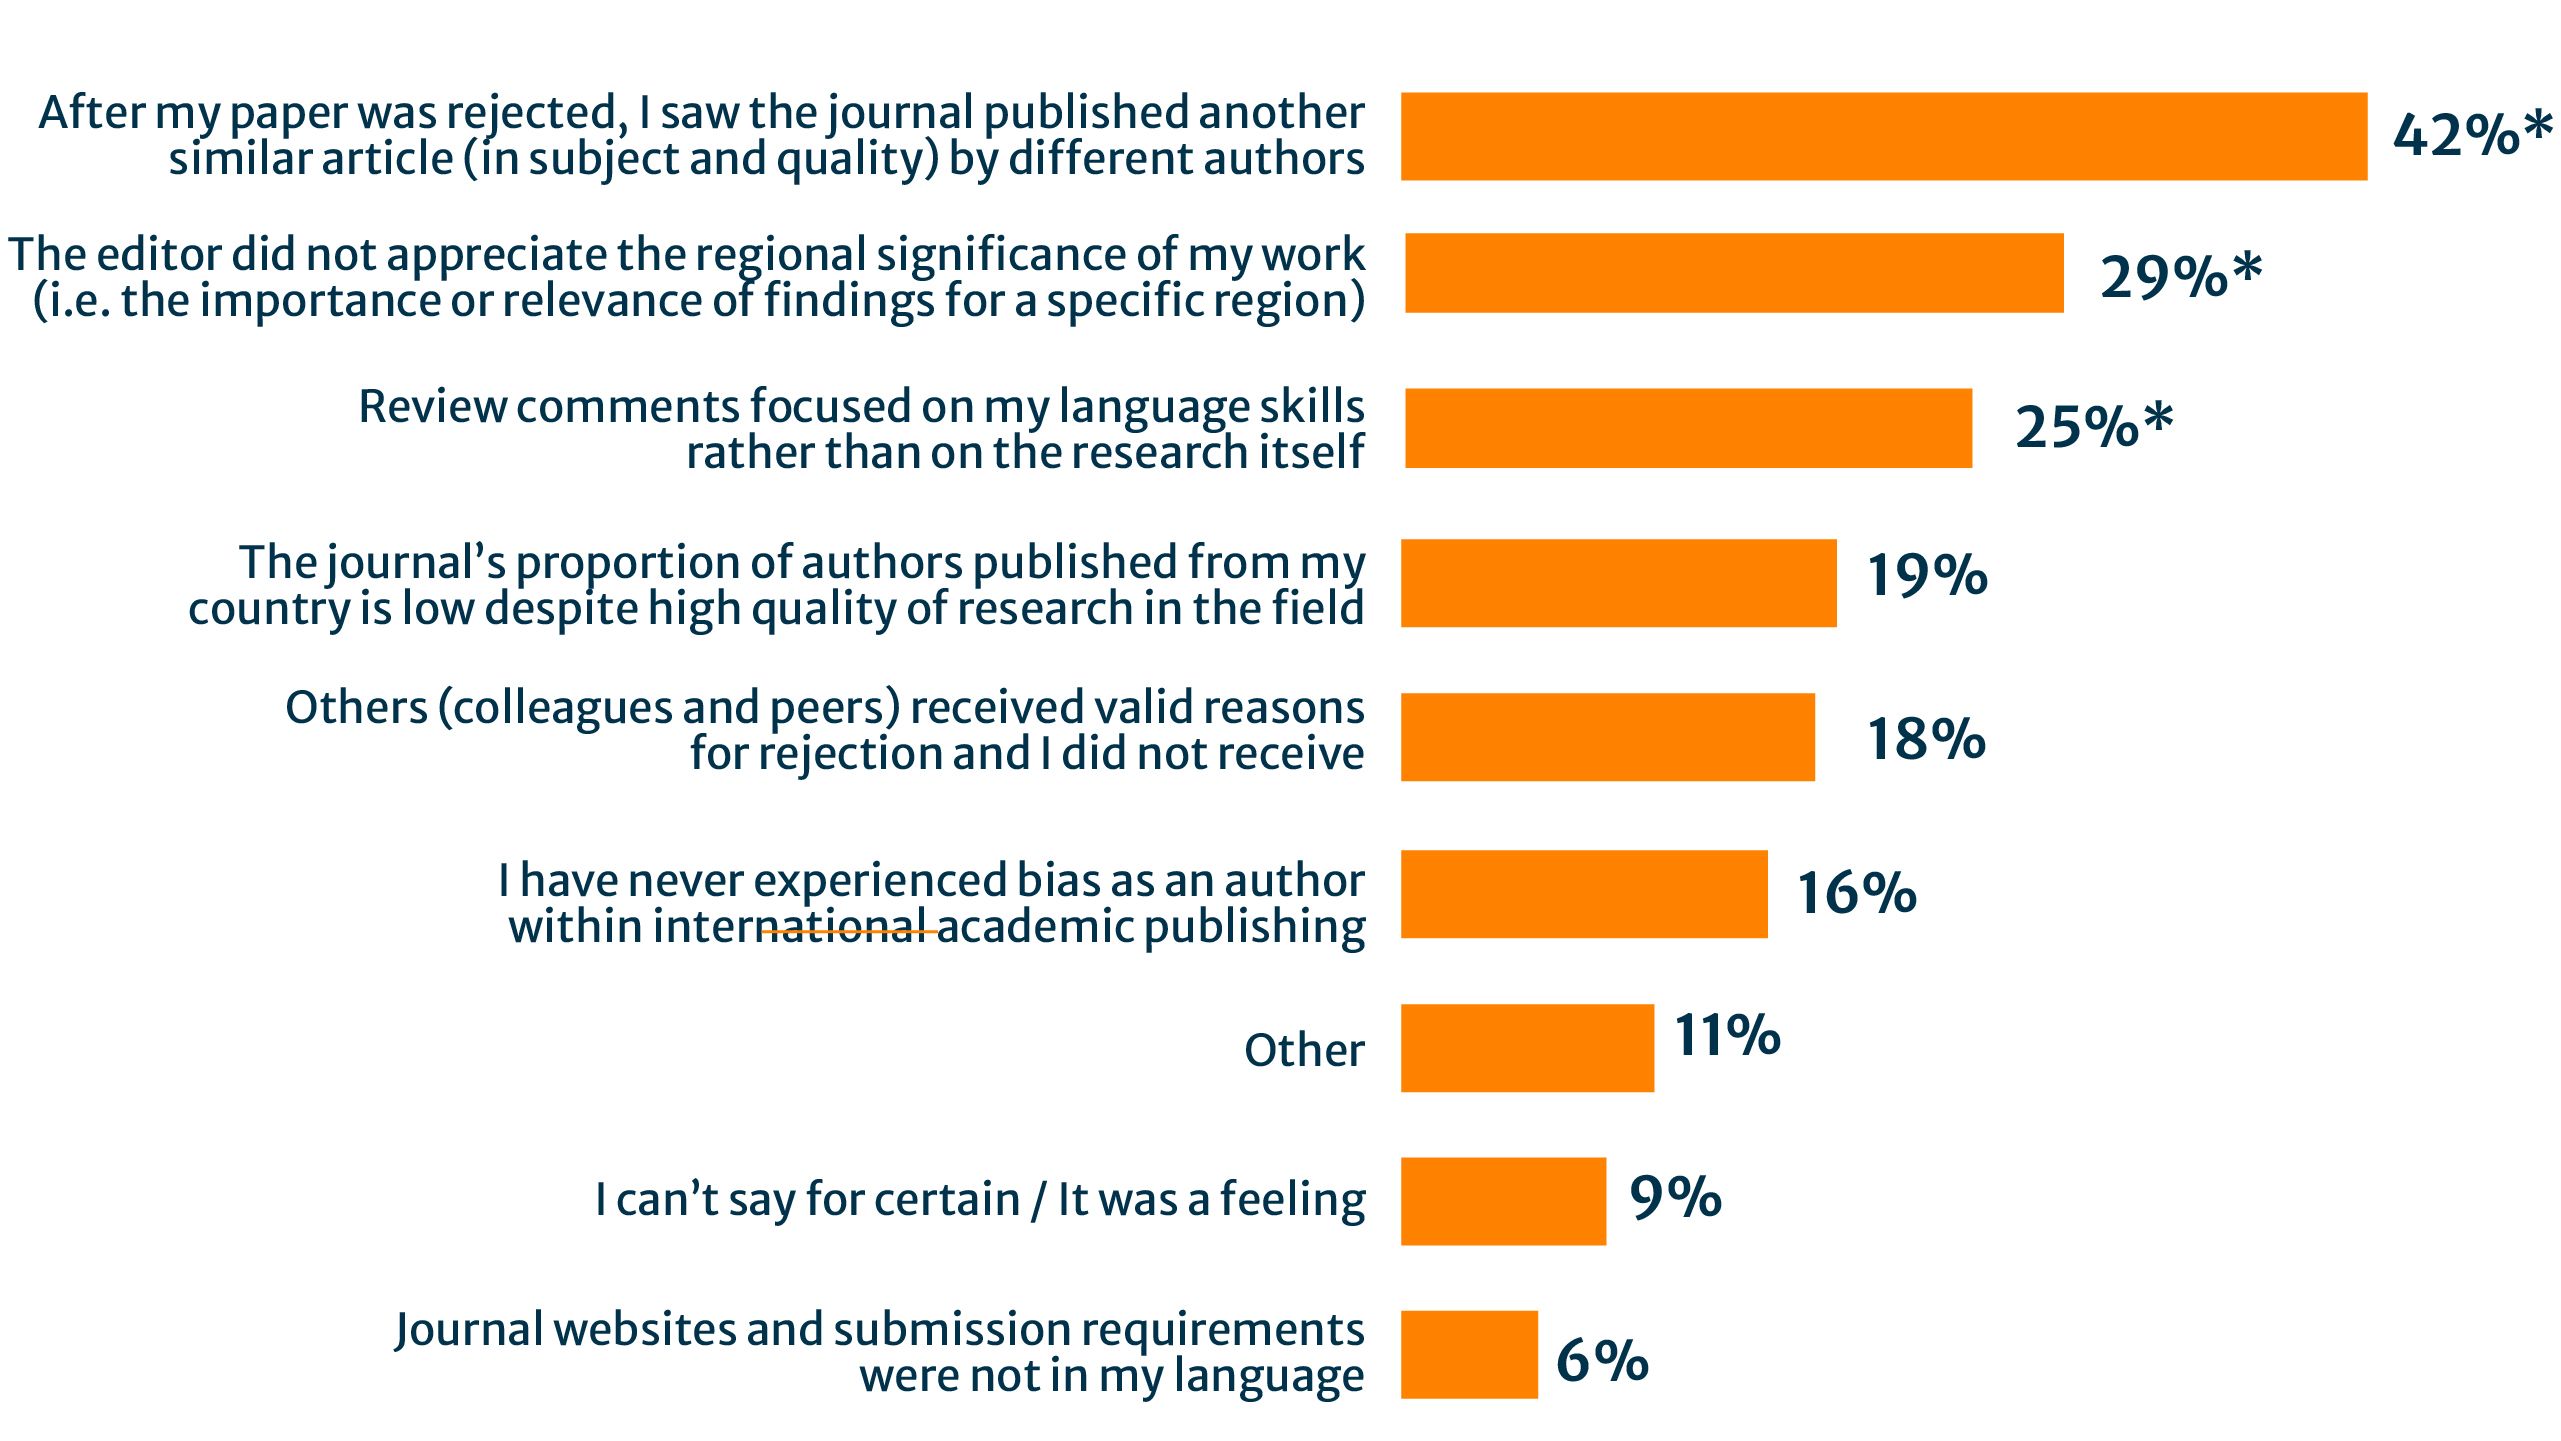
Respondents were asked about their personal experience of bias, and how they identified this during the publishing process (Fig. 4). 84% say they have experienced bias in some way. The most common experiences were being rejected and then seeing similar papers (defined by scope or quality) published by different authors in the journal. An apparent lack of appreciation for regional significance and reviewers focusing on language skills rather than on the calibre of the research also impacted over a quarter of respondents.
Figure 4: Indicators of individual experiences of bias
If you’ve ever personally experienced bias as an author when trying to publish your research within international academic publishing, how did you recognize that bias occurred? (n=7664)

*Indicates statistically significant at a p-value of 0.001.
Table Figure 4: Indicators of individual experiences of bias
|
% |
|
|---|---|
|
After my paper was rejected, I saw the journal published another similar article (in subject and quality) by different authors |
42%* |
|
The editor did not appreciate the regional significance of my work (i.e. the importance or relevance of findings for a specific region) |
29%* |
|
Review comments focused on my language skills rather than on the research itself |
25%* |
|
The journal’s proportion of authors published from my country is low despite high quality of research in the field |
19% |
|
Others (colleagues and peers) received valid reasons for rejection and I did not receive |
18% |
|
I have never experienced bias as an author within international academic publishing |
16% |
|
Other |
11% |
|
I can’t say for certain / It was a feeling |
9% |
|
Journal websites and submission requirements were not in my language |
6% |
*Indicates statistically significant at a p-value of 0.001.

"As an editor, I have seen certain U.S. and European reviewers repeatedly recommending rejection of apparently sound manuscripts from China with generic reviews that claim the work is not interesting and then recommend irrelevant and prohibitively expensive further experiments or calculations.
I have seen the same reviewers happily recommend seemingly similar works from other countries for publication."
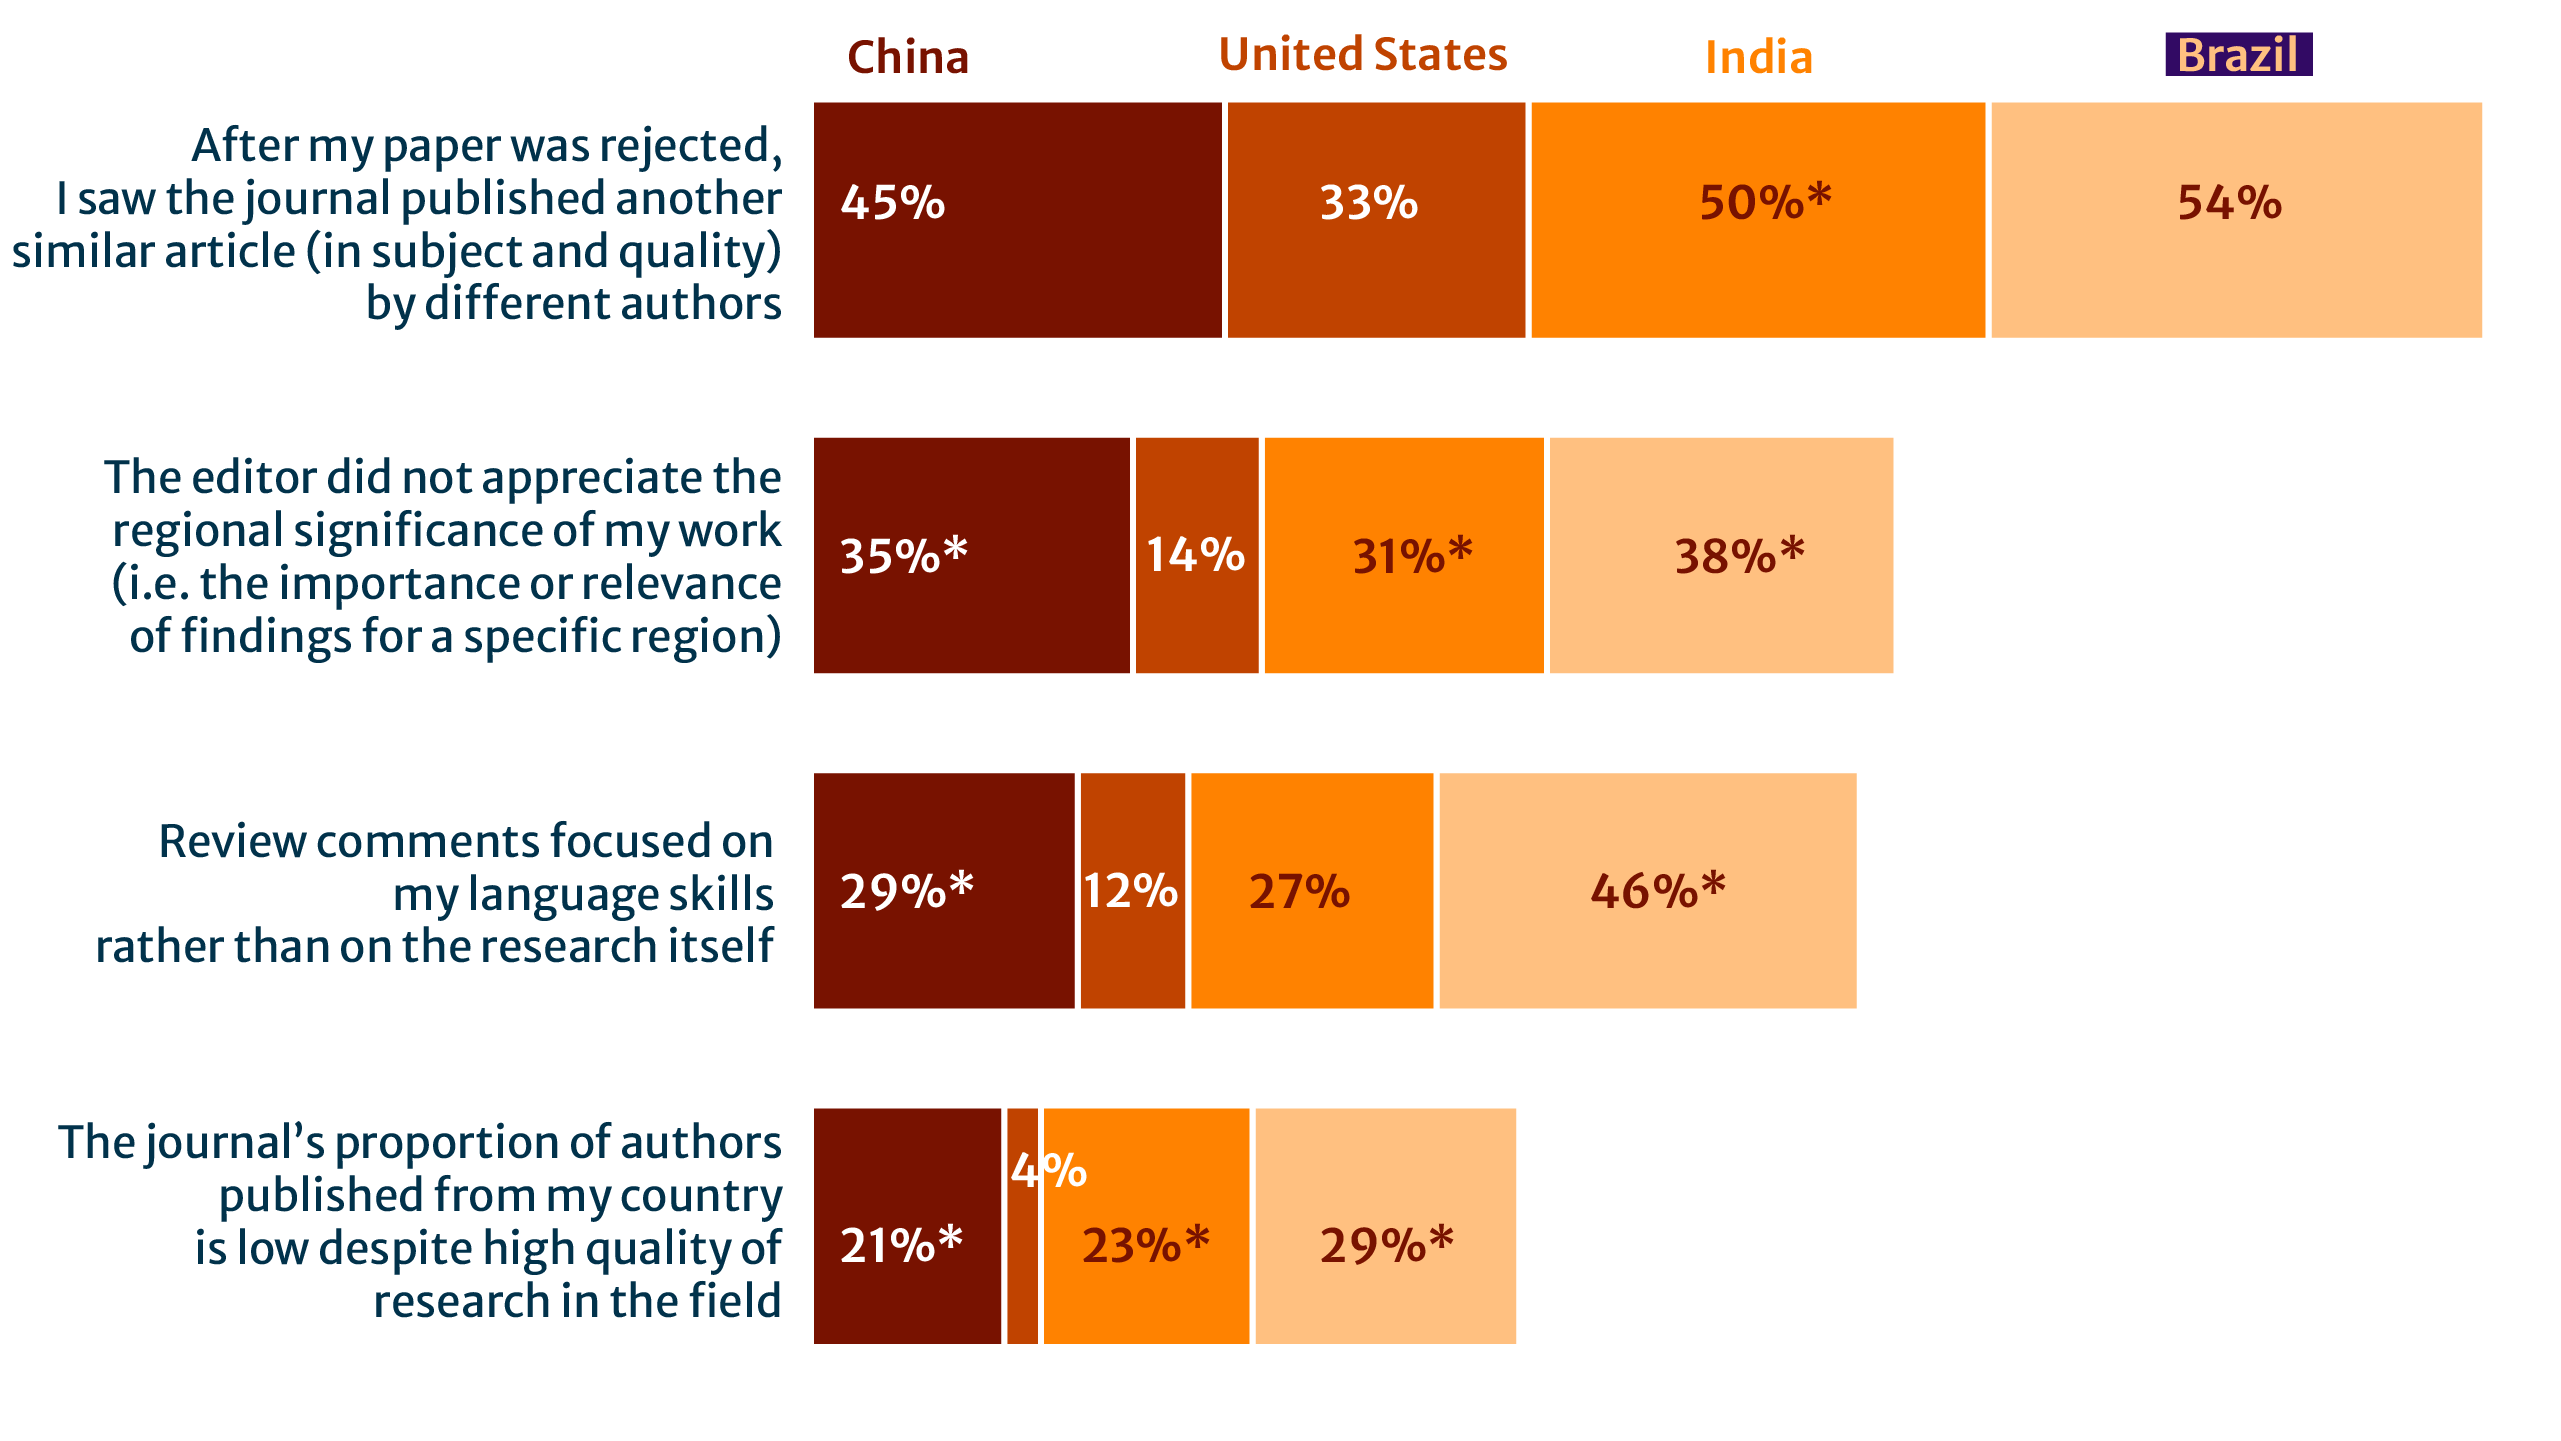
Experiences of bias vary widely based on region, broadly aligning with perceptions of bias among these groups (Section 1). Respondents in North America (30%) were most likely to indicate they had never personally experienced bias in academic publishing. Latin America & Caribbean (44%) and Sub-Saharan Africa (40%) stand out as the most impacted by a lack of appreciation for regional significance, whereas respondents from the Middle East & North Africa (54%) report experiencing editorial rejections followed by seeing similar studies published. Respondents from China, India, and Brazil consistently reported higher levels of bias along multiple indicators shown in Figure 5, further emphasising the prevalence of country-related bias.
Table 1: Country-related experiences of bias

*Indicates statistically significant at a p-value of 0.001.
Table Figure 1: Country-related experiences of bias
|
Column % |
1. China |
2. United |
3. India |
4. Brazil |
|---|---|---|---|---|
|
After my paper was rejected, I saw the journal published another similar article (in subject and quality) by different authors |
45% |
33% |
50%* |
54%* |
|
The editor did not appreciate the regional significance of my work (i.e. the importance or relevance of findings for a specific region) |
35%* |
14% |
31%* |
38% |
|
Review comments focused on my language skills rather than on the research itself |
29* |
12% |
27% |
46% |
|
The journal’s proportion of authors published from my country is low despite high quality of research in the field |
21%* |
4% |
23%* |
29% |
|
I have never experienced bias as an author within international academic publishing |
6% |
32% |
14% |
7% |
*Indicates statistically significant at a p-value of 0.001.
Section 3: How bias influences researchers’ submission behaviours
3.1 Nearly three-quarters of researchers consider the possibility of bias when deciding where to submit a paper
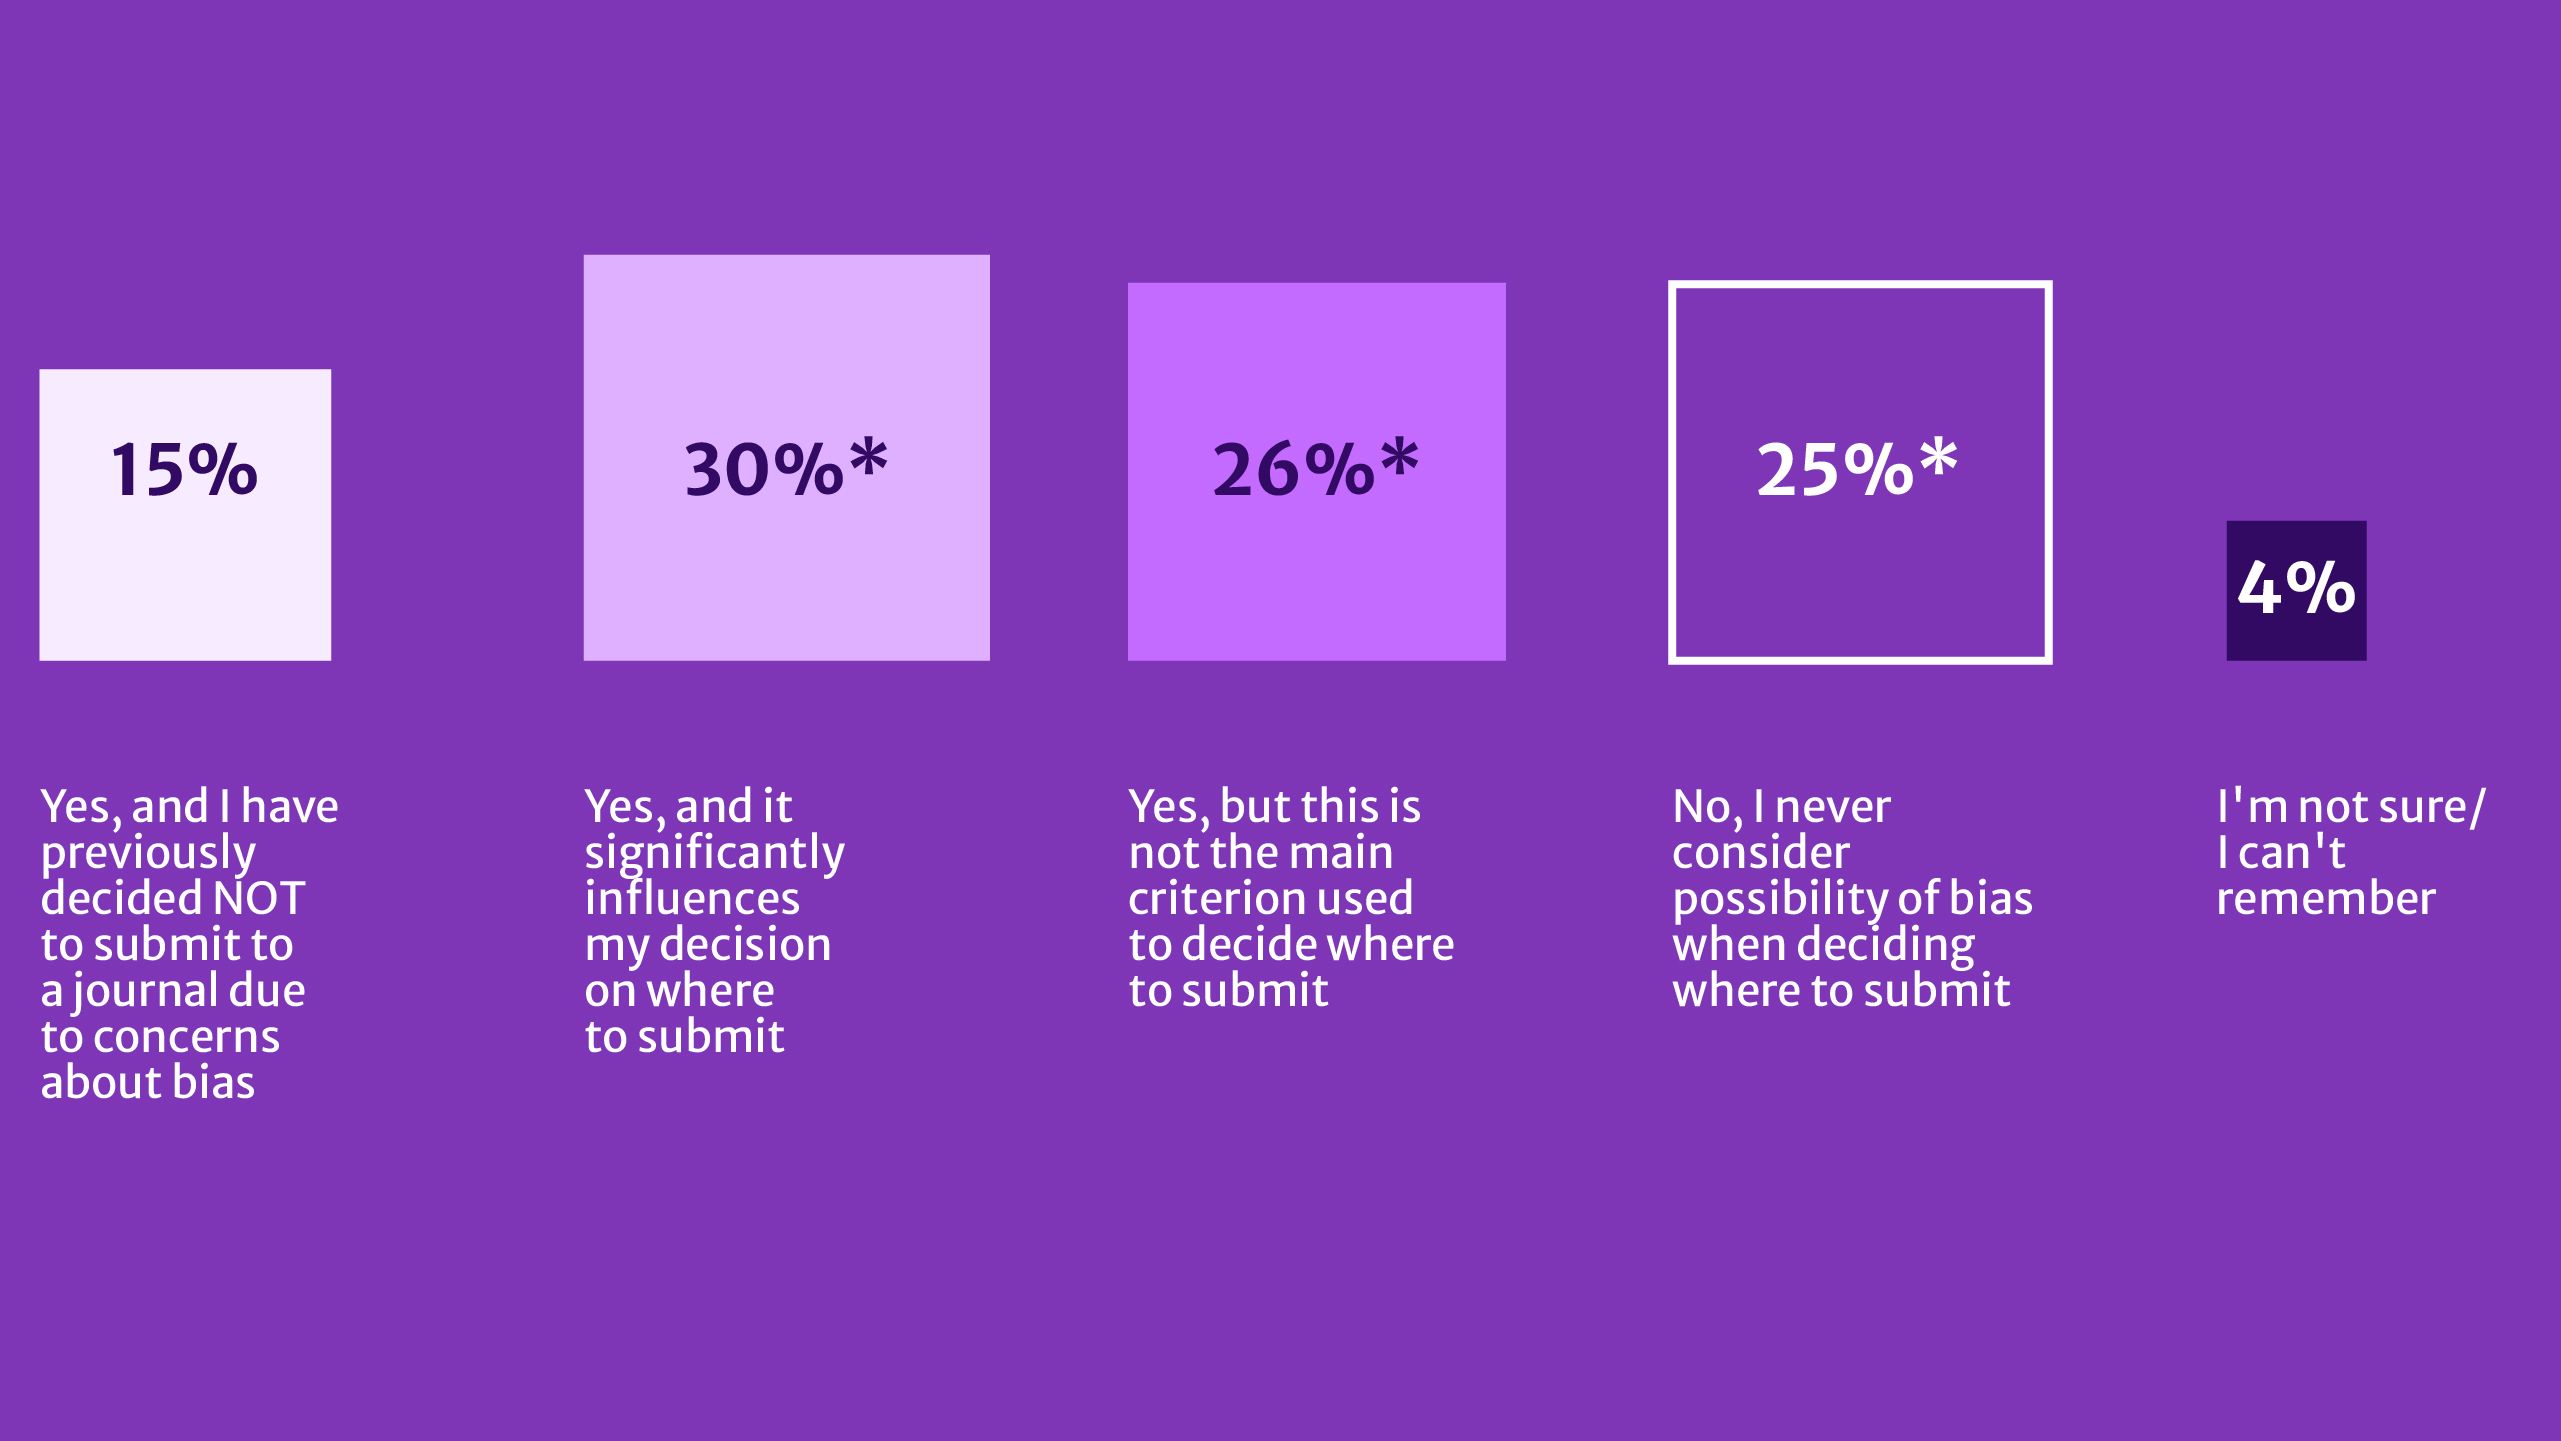
Our findings suggest that perceptions and experiences of bias have a significant impact on future publishing behaviour (Fig. 5). 72% of surveyed researchers said they take the possibility of bias into consideration when deciding where to submit a manuscript. 45% said influences their decision, including 15% who indicated they would not submit to a journal because of concerns related to bias.
The proportion of respondents who are significantly influenced by concerns of bias is especially strong among high-volume authors (57%), researchers from China (58%), Brazil (50%), and India (45%). Even the suspicion of bias is enough to encourage these cohorts of researchers to change their submission behaviours.
Figure 5: Ahead of manuscript submission
When considering where to submit your paper, have you or your colleagues ever taken the possibility of bias into account? (n=7931)

*Indicates statistically significant at a p-value of 0.001.
Table Figure 5: Ahead of manuscript submission
|
Yes, and I have previously decided NOT to submit to a journal due to concerns about bias |
15% |
|
Yes, and it significantly influences my decision on where to submit |
30%* |
|
Yes, but this is not the main criteria used to decide where to submit |
26%* |
|
No, I never consider possibility of bias when deciding where to submit |
25%* |
|
I'm not sure/I can't remember |
4% |
*Indicates statistically significant at a p-value of 0.001.
Finally after experiencing what they perceive to have been a biased editorial and/or peer review process, 30% of researchers say they will not submit to a journal again.
3.2. Researchers use a range of strategies to evaluate bias before deciding where to submit
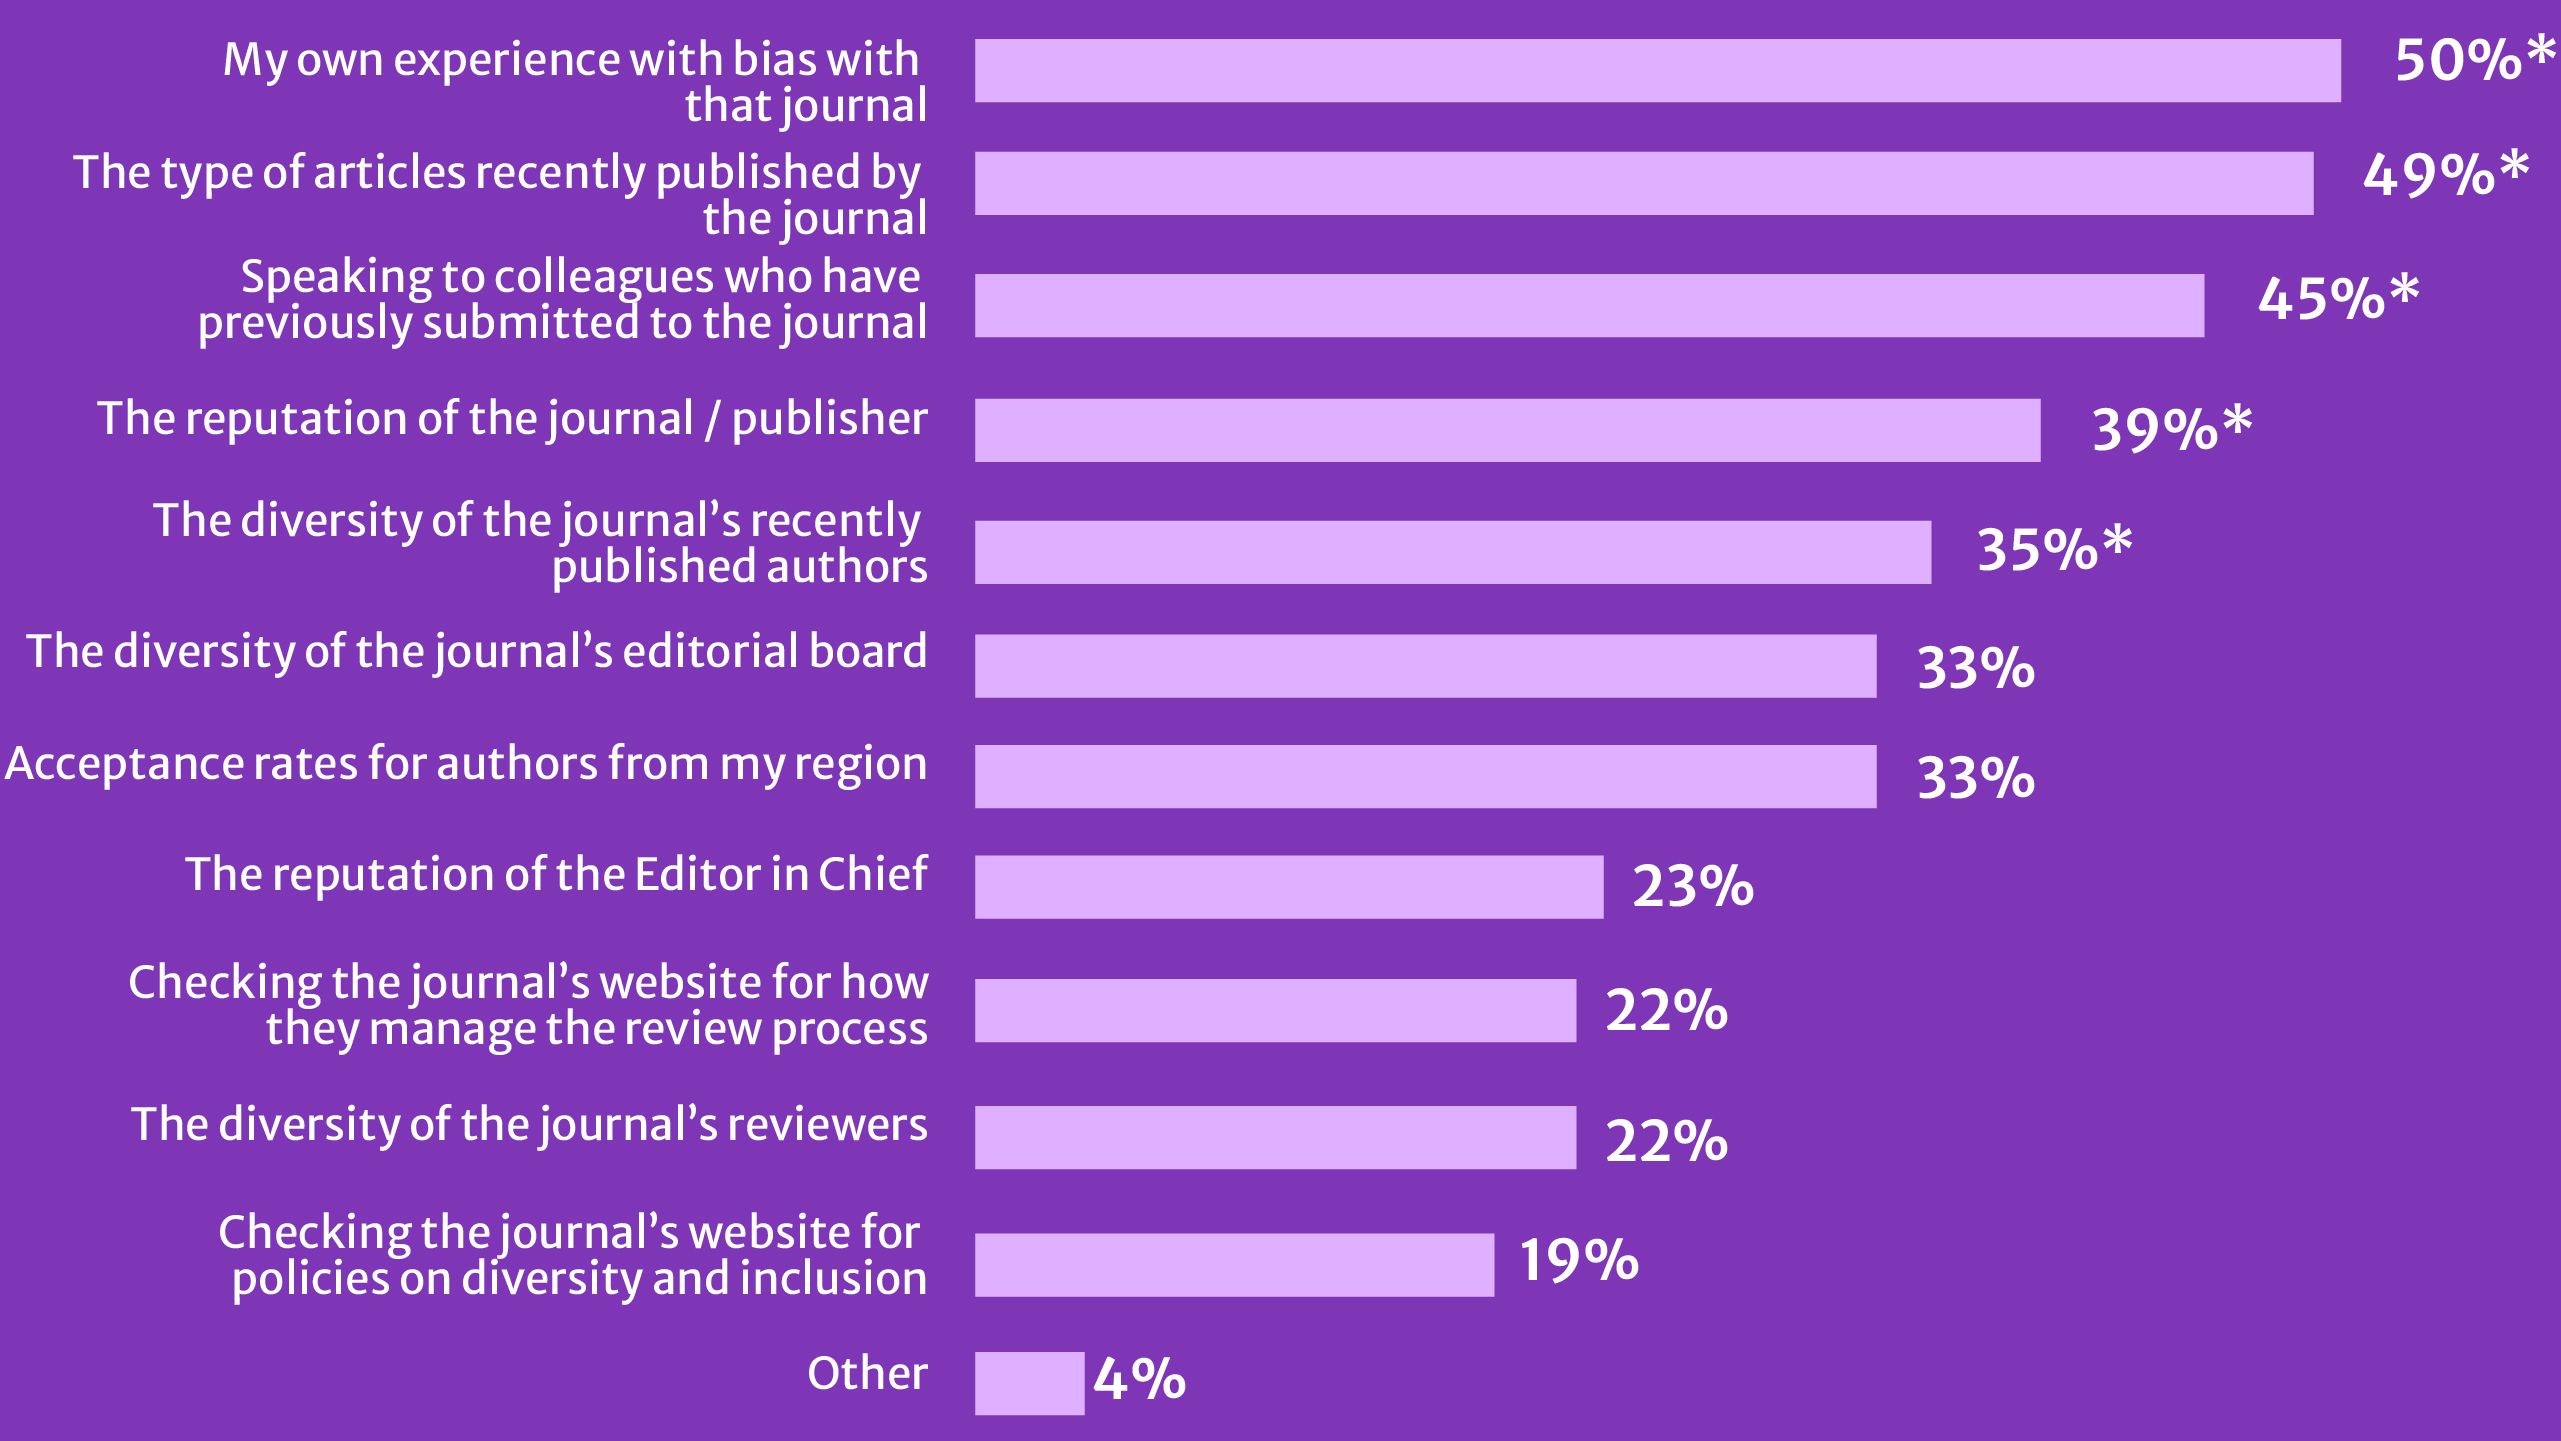
Figure 6 shows some of the main strategies researchers use to assess the potential for bias, including their own previous experiences (50%), the diversity of articles published by the journal (49%), and feedback from colleagues (45%). This peer feedback is particularly critical, since 42% of surveyed researchers who reported that they had experienced bias said that they shared their experiences with colleagues, potentially deterring others from submitting to that journal. Other strategies to evaluate the possibility of bias include considering the diversity of the editorial board and published authors, and the reputation of the journal and publisher.
Figure 6: Strategies researchers use to assess potential bias
How do you assess whether a journal is biased before deciding whether to submit your manuscript? (n=5643)

*Indicates statistically significant at a p-value of 0.001.
Table Figure 6: Strategies researchers use to assess potential bias
|
% |
|
|---|---|
|
My own experience with bias with that journal |
50% |
|
The type of articles recently published by the journal |
49% |
|
Speaking to colleagues who have previously submitted to the journal |
45% |
|
The reputation of the journal / publisher |
39% |
|
The diversity of the journal’s recently published authors |
35% |
|
The diversity of the journal’s editorial board |
33% |
|
Acceptance rates for authors from my region |
33% |
|
The reputation of the Editor in Chief |
23% |
|
Checking the journal’s website for how they manage the review process |
22% |
|
The diversity of the journal’s reviewers |
22% |
|
Checking the journal’s website for policies on diversity and inclusion |
19% |
|
Other |
4% |
*Indicates statistically significant at a p-value of 0.001.
Unsurprisingly, given the prevalence of perceived and experienced country-related bias, researchers from the Global South were particularly alert to regional representation of editors and were more likely to check acceptance rates for authors from their region. Interestingly, early career researchers as well as women were also more likely to look for markers of diversity, such as the diversity of the journal’s recently published authors or checking the journal’s website for policies on diversity and inclusion.
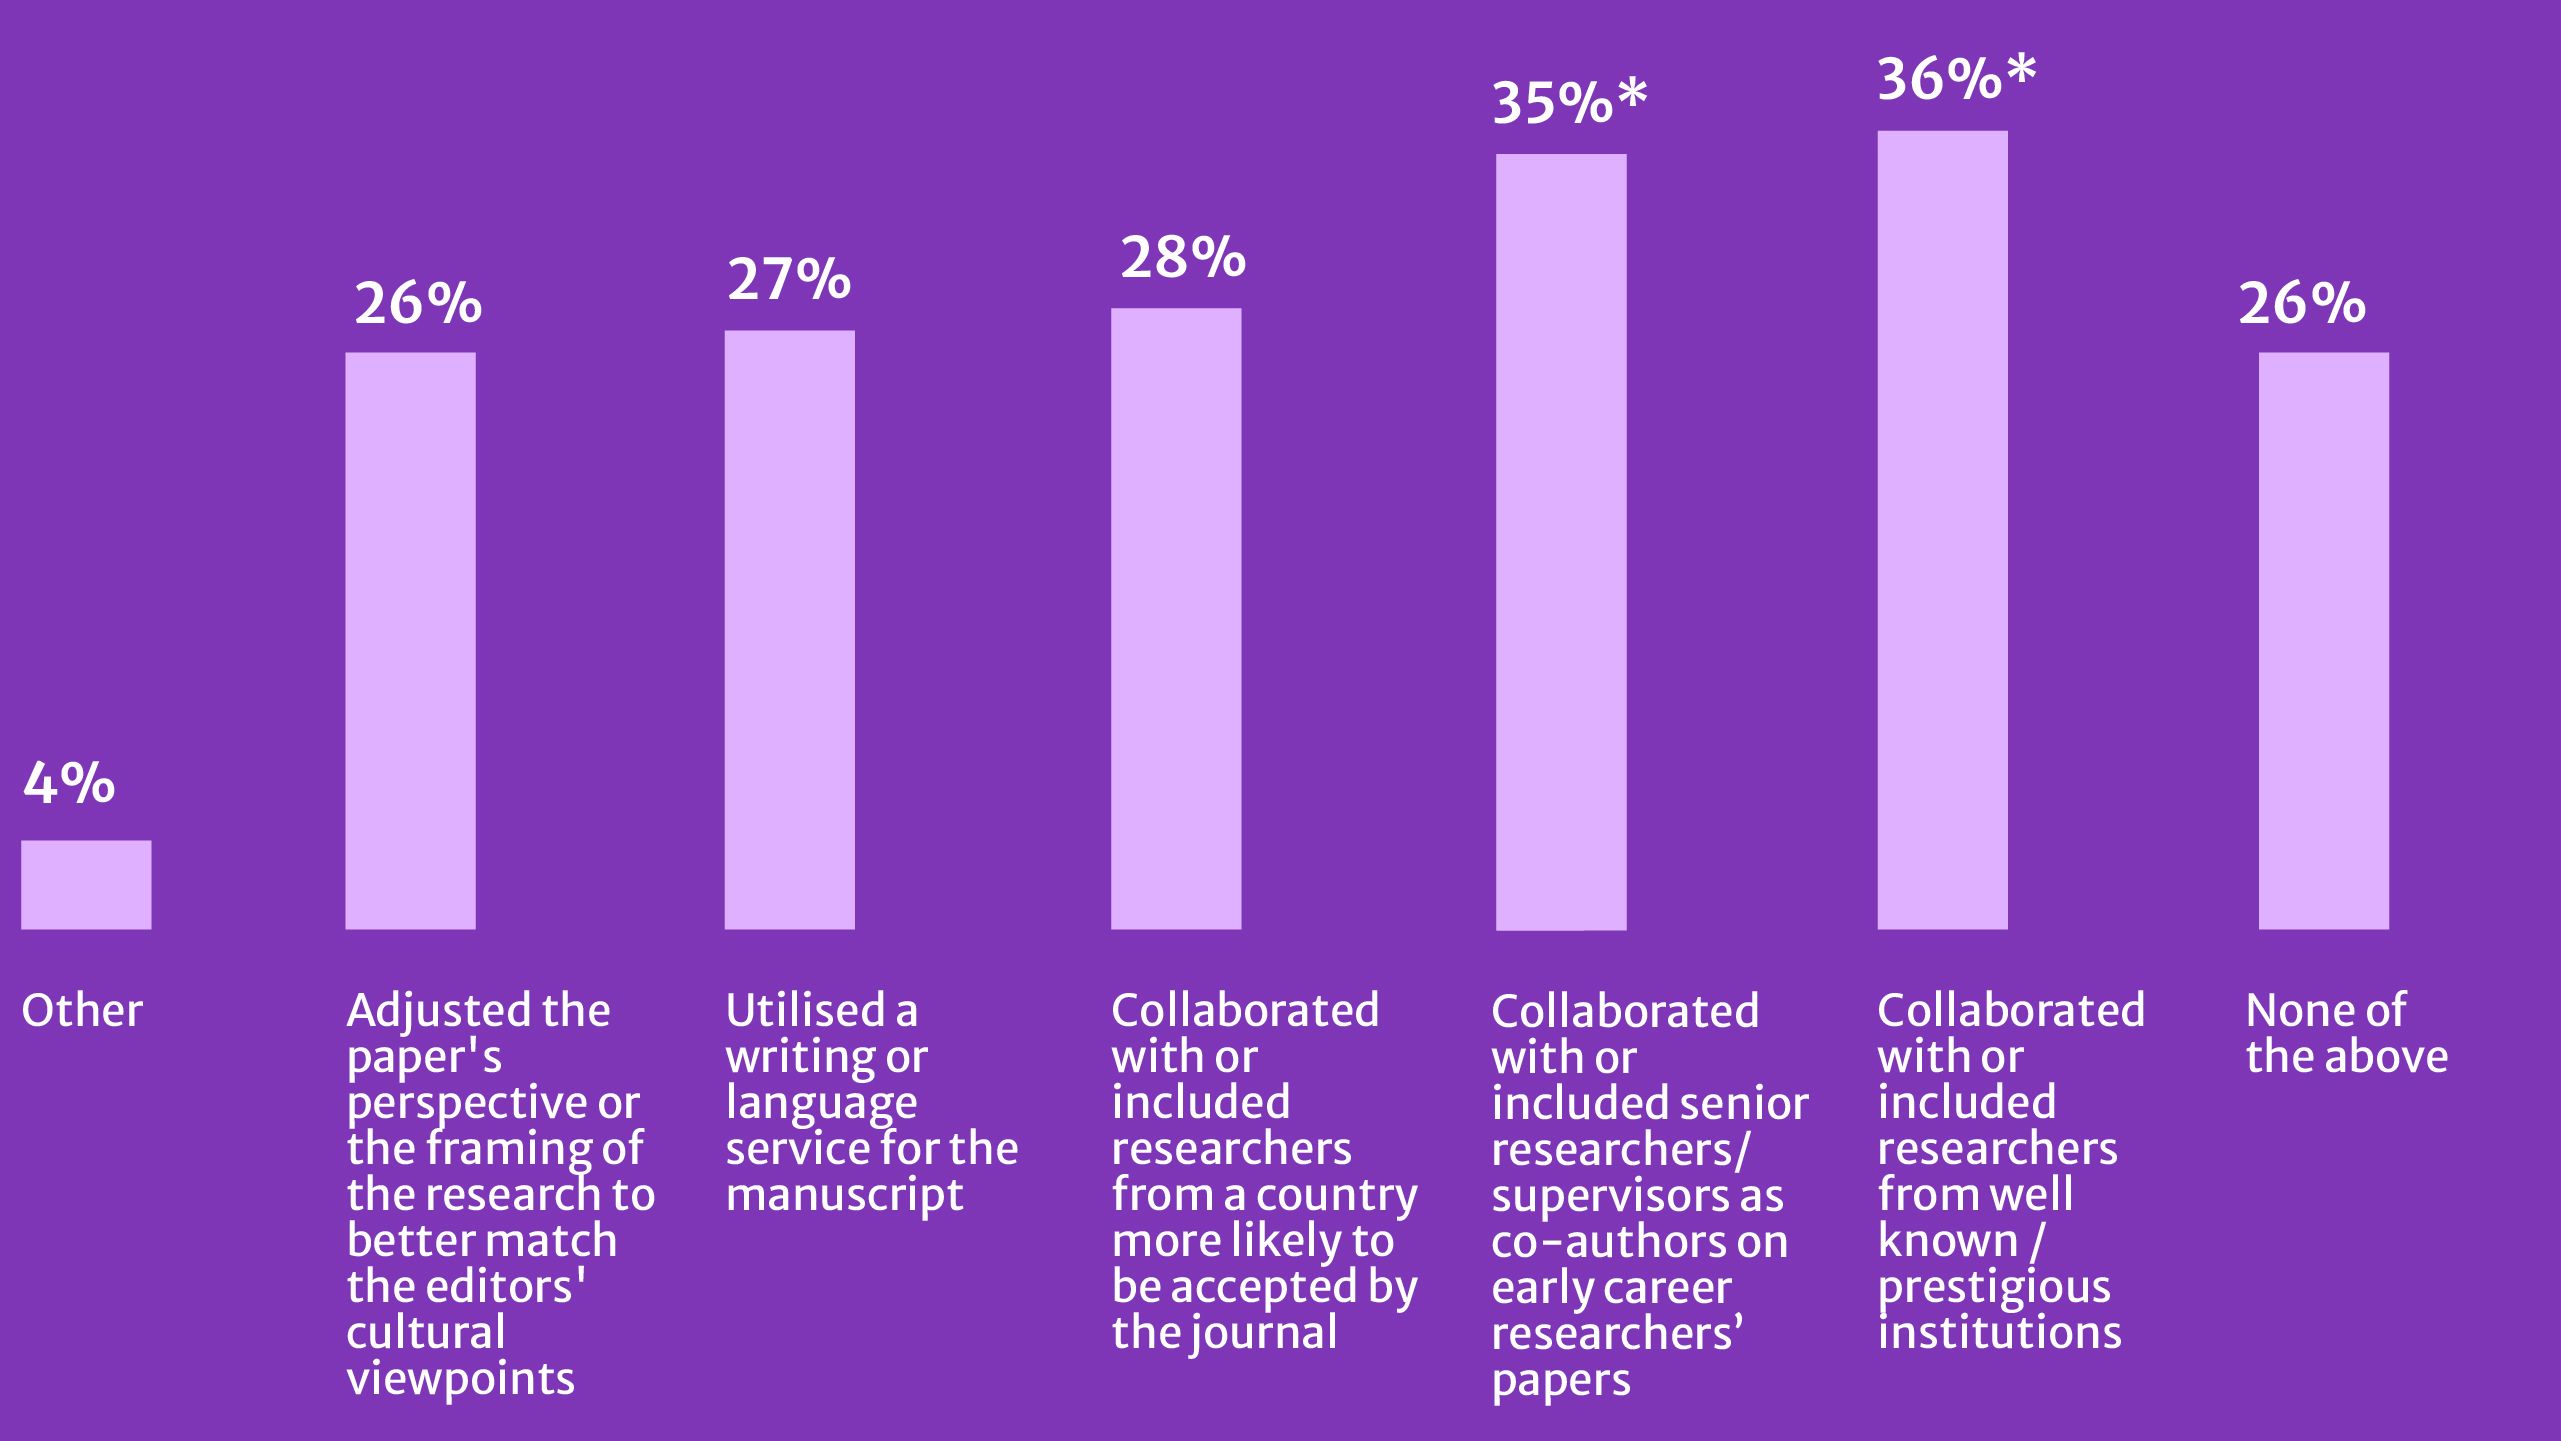
3.3. Three-quarters of researchers engage in strategies to decrease potential for bias
Most researchers have used some strategy to decrease the potential risk of bias when submitting to a journal (Fig. 7). Collaborations were common, particularly for early-career researchers and those based in regions where perceptions of bias are strongest.
Figure 7: Strategies researchers use to reduce potential for bias
Have you or your colleagues ever taken any of the following actions with the aim of decreasing the potential risk of bias against your manuscript?

*Indicates statistically significant at a p-value of 0.001.
Table Figure 7: Strategies researchers use to reduce potential for bias
|
% |
|
|---|---|
|
Other |
4% |
|
Adjusted the paper's perspective or the framing of the research to better match the editors' cultural viewpoints |
26% |
|
Utilised a writing or language service for the manuscript |
27% |
|
Collaborated with or included researchers from a country more likely to be accepted by the journal |
28% |
|
Collaborated with or included senior researchers/supervisors as co-authors on early career researchers’ papers |
35% |
|
Collaborated with or included researchers from well known / prestigious institutions |
36% |
|
None of the above |
26% |
*Indicates statistically significant at a p-value of 0.001.
Early career researchers are significantly more likely to collaborate with senior researchers or include them as co-authors to their papers (43%). Researchers in China are most likely to employ all these strategies to decrease their risk of bias. The use of a writing service was also high among researchers in Spain (51%), Brazil (49%), Japan (48%), Indonesia (45%), and China (41%). In contrast, researchers in the USA (39%) were most likely to not employ any of these strategies.
Section 4: Researcher expectations: what can publishers do?
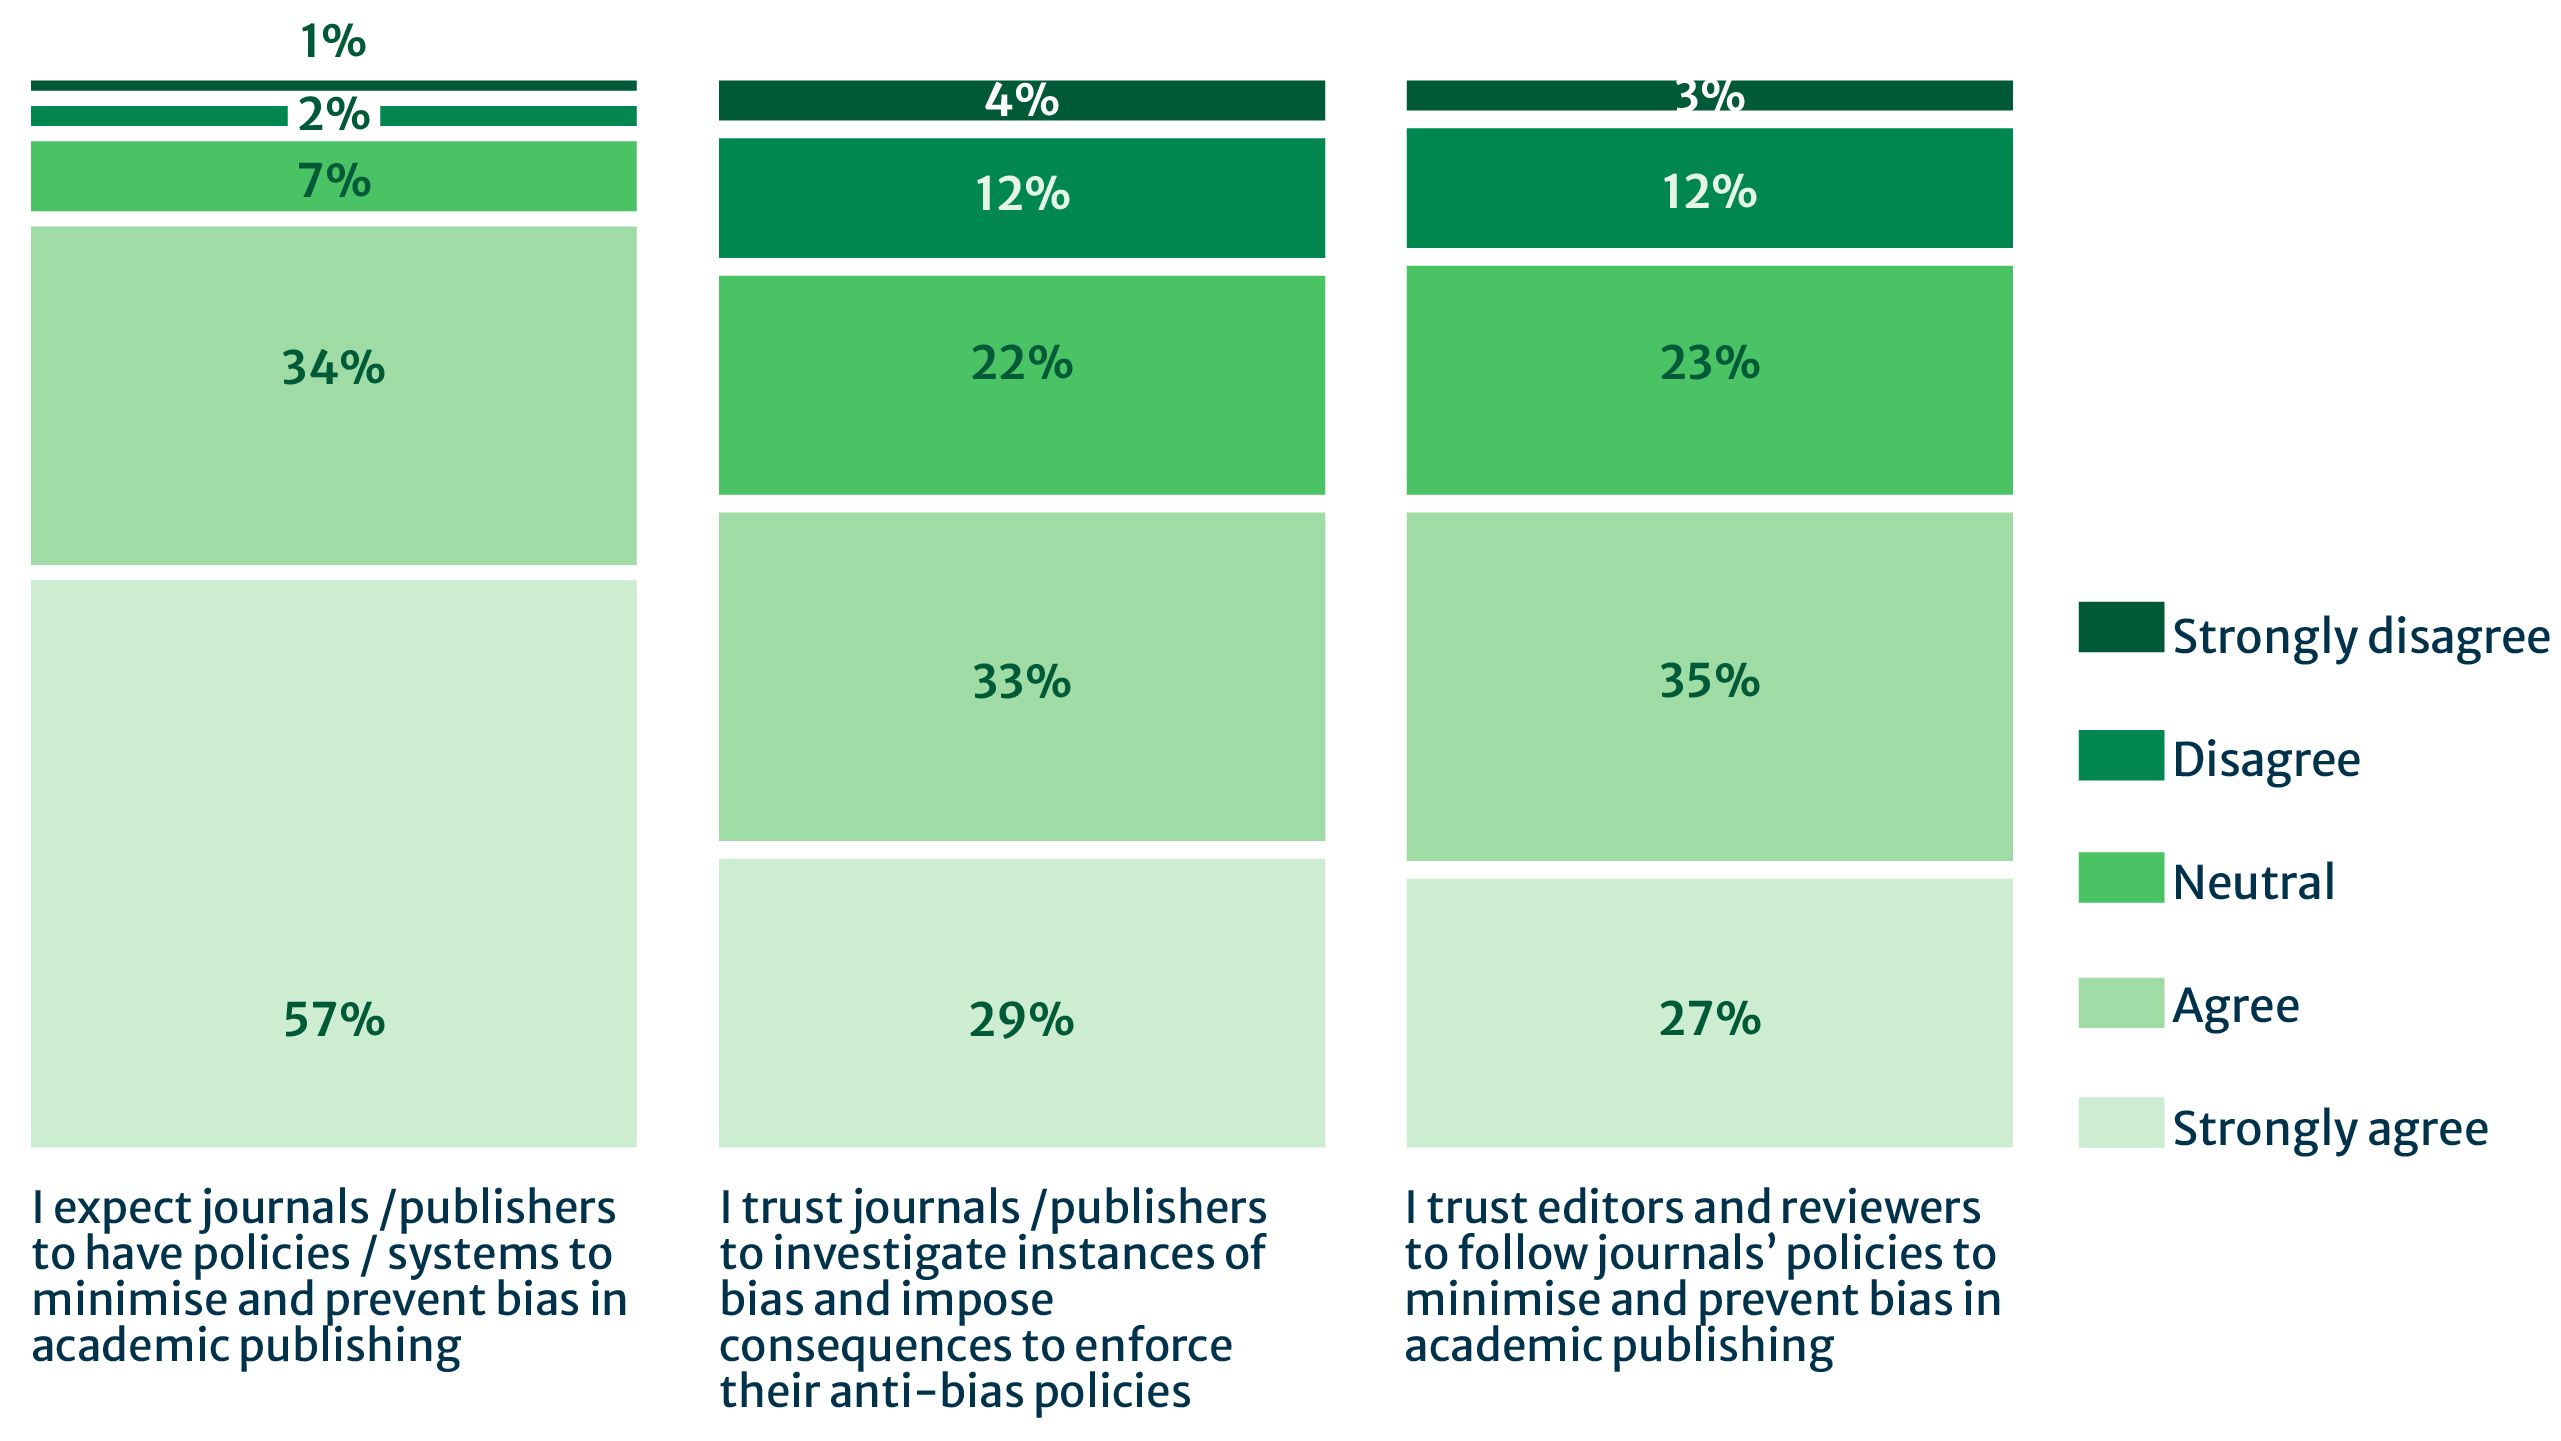
The overwhelming majority of respondents in our survey expect publishers to adopt or uphold policies and systems to prevent and minimise bias (91%) and establish procedures for investigating instances of bias (62%). However, although almost two-thirds said that they trust publishers (as well as editors and reviewers) to do so, 15% remain skeptical (Fig. 8).
Figure 8: Researcher expectations of publishers
To what extent do you agree with the following statements?

*Indicates statistically significant at a p-value of 0.001. Percentages may not total 100% due to rounding.
Table Figure 8: Researcher expectations of publishers
|
Row % |
Strongly agree |
Agree |
Neutral |
Disagree |
Strongly disagree |
|---|---|---|---|---|---|
|
I expect journals /publishers to have policies / systems to minimise and prevent bias in academic publishing |
57% |
34% |
7% |
2% |
1% |
|
I trust journals /publishers to investigate instances of bias and impose consequences to enforce their anti-bias policies |
29% |
33% |
22% |
12% |
4% |
|
I trust editors and reviewers to follow journals’ policies to minimise and prevent bias in academic publishing |
27% |
35% |
23% |
12% |
3% |
*Indicates statistically significant at a p-value of 0.001. Percentages may not total 100% due to rounding.
Respondents identified editors as having the greatest influence on publishing outcomes, and therefore the greatest responsibility for ensuring fairness.
Table 2: How publishers can support editors and reviewers in reducing bias
|
Editors |
Reviewers |
|
|---|---|---|
|
1. |
Training (62%): Given the prominent influence that editors were seen to have, it is not surprising to see that most respondents want more training for editors, to recognise, manage, and mitigate bias. |
Guidelines (56%): A little over half of researchers feel that reviewers should be provided with guidelines on how to minimise bias in peer review. |
|
2. |
Transparency (53%): Over half of respondents want greater visibility into editorial decision processes, with the highest support for this coming from authors in Sub-Saharan Africa (61%). |
Transparent or double anonymised review (53%): Many researchers view transparency and/or anonymisation as a practical step toward reducing the potential for affiliation, gender, or regional bias. |
|
3. |
Prioritise science over language (52%): Consistent with earlier findings, researchers in Latin America & Caribbean (63%) and Sub-Saharan Africa (60%) want to see more prioritisation of scientific content over language. |
Training (51%): Targeted training on how to deliver constructive, bias-free feedback is viewed as essential. |
Increasing the regional diversity of editors and reviewers stood out as an area for improvement in responses from researchers in China (53% editors & 48% for reviewers) and India (48% & 42% ) versus the USA (41% and 40%). Support for regional diversity of editors and reviewers was especially notable among researchers from Latin America & Caribbean, Middle East & North Africa, and Sub-Saharan Africa with a clear majority supporting greater diversity.
Beyond editor and reviewer actions, respondents highlighted several broader measures that could help make the publication process more inclusive and transparent. These include:
- Language tools and support for submission (59%): Providing editing or translation tools at the point of submission or review was viewed as the most effective additional step, particularly among researchers from East Asia & Pacific (65%) and Sub-Saharan Africa (70%).
- Accessible guidelines in multiple languages (39%): These would reduce the communication barriers that may inadvertently disadvantage researchers for whom English is not a primary language. This was significant for researchers from East Asia & Pacific (47%) and Sub-Saharan Africa (59%).
- Information on author diversity (36%): Respondents support greater openness around author demographics to help demonstrate progress toward more inclusive publishing practices. This was significant for researchers from East Asia & Pacific (42%), Sub-Saharan Africa (49%), and South Asia (43%)
Section 5: Looking ahead
Bias in academic publishing can be challenging to prove, and as we have indicated, much of what is reported here reflects perceptions and experiences of bias. What is clear is that perceptions are powerful and can have a profound impact on researcher behaviours. They can impact researcher trust and publishing decisions, resulting in tangible reputational and operational risks for publishers. Perceptions of country-related bias are widespread, reinforced by concerns about biases related to institutional affiliation, network and language.
Our report highlights three critical areas for publishers to minimise bias and ensure fair, rigorous evaluation of research through the publication process: addressing regional disparities, increasing transparency, and providing training and follow-up for editors and reviewers.
Address regional disparities
- Continue to expand representation from underrepresented groups, particularly those in the Global South.
- Invest in training and mentorship programmes to support new editors and reviewers from diverse backgrounds.
- Provide accessible language support for authors whose first language is not English.
Increase transparency
- Clear and transparent processes, including transparent peer review and the publication of reviewer feedback, may help to counter the strong perception of bias.
Provide training and follow-up
- Offer bias awareness and inclusive review training for editors and reviewers, focusing on evaluating scientific rigour over language or institutional prestige.
- Encourage editors and reviewers to provide constructive, respectful feedback that avoids personal or cultural bias.
- Create processes for proactive follow-up when authors raise concerns about bias, ensuring issues are acknowledged and addressed.
We continue to advance our efforts across key areas identified by researchers in this survey: increasing the regional diversity of our external academic editors to better reflect the global diversity of the research landscape, expanding bias awareness training for editors, increasing transparency through initiatives such as transparent peer review (now available across all Nature family journals and the BMC Series journals) and supporting authors with language-focused services. Addressing bias is not only an ethical imperative, but it is also critical to ensuring a more complete and representative global knowledge base, which Springer Nature commits to building. These data underscore the need for publishers to proactively work on widening participation in the research publishing process, reducing bias, strengthening researcher trust, and ensuring that all research is assessed on its merits.

Appendix
Methodology
The survey instrument was developed as a collaboration between Springer Nature's Global Inclusion in Research Publishing team and the Market Intelligence team, and is informed by seven scoping interviews with researchers in China, India, and Brazil.
The survey was distributed globally to researchers in 2024 to understand perceptions and experience of fairness and bias in peer review in international academic journals across the scholarly publishing landscape.
The following definition of bias was inserted at the beginning of the survey to provide context for the research and ensure that all participants had the same understanding:
“The word ‘bias’ can mean many different things in different situations. For the purpose of this survey, we are defining it as follows:
- Bias is a prejudice against or a preference for people based on a group they belong to, often resulting in discrimination or favouritism of those people when acted upon.
- Bias can be present against or for numerous attributes, such as certain countries, languages, perceived institutional prestige, seniority, gender, race, ethnicity, disciplines, political beliefs, etc.
- Bias can be conscious or unconscious.
For the purposes of this survey, we are NOT including journal scope or selection criteria for novelty as part of our definition for bias.”
The survey received a total of 11,866 responses. Data cleaning removed duplicate or incomplete responses, likely bots, entries from non-academic respondents (for example, clinicians or librarians), and retired individuals. This resulted in 8,485 valid responses for analysis.
Quantitative results were analysed using descriptive statistics and cross-tabulation by key demographics (region, gender, seniority, and publication volume – see below). Open-text comments were thematically coded to identify recurring experiences and perceptions of bias.
Statistically significant results (highlighted by segment-specific callouts throughout the report or an asterisk for overall figures) were identified using an analysis software at a p-value of 0.001, indicating a confidence level of 99.9% that these findings are not due to random chance.
Figures highlighting data for specific segments represent the proportion within that segment, not the proportion of the overall sample. All data presented are unweighted.
Who is represented in our report?
Responses were segmented by self-reported demographics, including career stage, gender, region, publication volume, and discipline. Regions were grouped according to World Bank Region mapping.
Respondents in numbers
Total responses: 11,866
Analysed responses: 8,485
|
Location of respondents (n=7,846) |
% |
n |
|---|---|---|
|
East Asia & Pacific |
22% |
1,722 |
|
Europe & Central Asia |
24% |
1,917 |
|
Latin America & Caribbean |
7% |
545 |
|
Middle East & North Africa |
7% |
524 |
|
North America |
14% |
1,126 |
|
South Asia |
18% |
1,380 |
|
Sub-Saharan Africa |
8% |
632 |
We chose to highlight results from the top three producers of research publication output – China, USA and India – where there was enough data to do so.6 We have also highlighted data from regions and countries where findings were significant, particularly Brazil, where respondents reported high levels of perception of bias.
Seniority (n=7,768)*
Senior Researcher (51%)
Mid-career researcher (28%)
Early career researcher / student (20%)
*totals may not equal 100% due to rounding
Gender (n= 7,374)*
Man 70%
Woman 26%
Prefer not to disclose 4%
Self-described 1%
Non-binary or gender diverse 1%
*totals may not equal 100% due to rounding
|
Publishing volume in the last 2 years (n=8,485) |
% |
n |
|
High volume (15+) |
10% |
809 |
|
Medium volume (5-14) |
32% |
2,745 |
|
Low volume (1-4) |
50% |
4,281 |
|
Not active |
8% |
650 |
|
NET |
100% |
8,485 |
|
Disciplines (n=7,803) |
% |
n |
|---|---|---|
|
Biological Sciences |
22% |
1,693 |
|
Health Sciences |
18% |
1,383 |
|
Humanities & Social Sciences |
17% |
1,317 |
|
Engineering |
10% |
757 |
|
Earth and Environmental Sciences |
7% |
533 |
|
Computer Sciences |
5% |
416 |
|
Mathematics |
4% |
349 |
|
Chemical Sciences |
4% |
339 |
|
Physics and Astronomy |
3% |
269 |
|
Materials Sciences |
3% |
258 |
|
Energy |
1% |
62 |
|
Agricultural, Veterinary and Food Sciences |
1% |
57 |
|
Multidisciplinary Sciences |
1% |
41 |
|
Other |
4% |
329 |
Limitations
While our approach provided broad coverage across disciplines and geographies, since participants were recruited from Springer Nature’s internal email lists, the sample should be considered a convenience sample rather than a statistically representative sample of the global research community.
The survey did not capture whether respondents had experience with both academic article publishing and book publishing. Therefore, opinions on bias may reflect familiarity with journal articles rather than a comparative assessment across formats.
Women and non-binary or gender diverse researchers were underrepresented in the survey dataset.
Authors
Farah Aldabbagh
Research Analyst
Springer Nature
Mithu Lucraft
Senior Consultant
TBI Communications
Aman Ganpatsingh
Senior Content Marketing Manager
Springer Nature
Sowmya Swaminathan
Director, Global Inclusion, Research
Springer Nature
How to cite this report
Springer Nature (2026, April). Perceptions of fairness and bias in the scholarly publishing ecosystem: a global survey

References
Links open in a new window
1 World Bank region mapping: https://datatopics.worldbank.org/world-development-indicators/the-world-by-income-and-region.html
2 Countries were mapped against World Bank regions
3 Those with the highest publishing volumes: have published 15 articles or more in two years.
4 Lee, C. J., Sugimoto, C. R., Zhang, G., & Cronin, B. (2013). Bias in peer review. Journal of the American Society for Information Science and Technology, 64(1), 2–17. https://doi.org/10.1002/asi.22784
5 IOP Publishing (2024). The State of Peer Review 2024. https://ioppublishing.org/state-of-peer-review-2024/
6 Based on Dimensions reporting